CORE GUIDANCE
Data Visualization
Overview
Oftentimes the story behind data is better communicated visually than it is with just words. Data visualizations help us to tell more compelling stories, in ownable, easy-to-understand ways.
Guidance
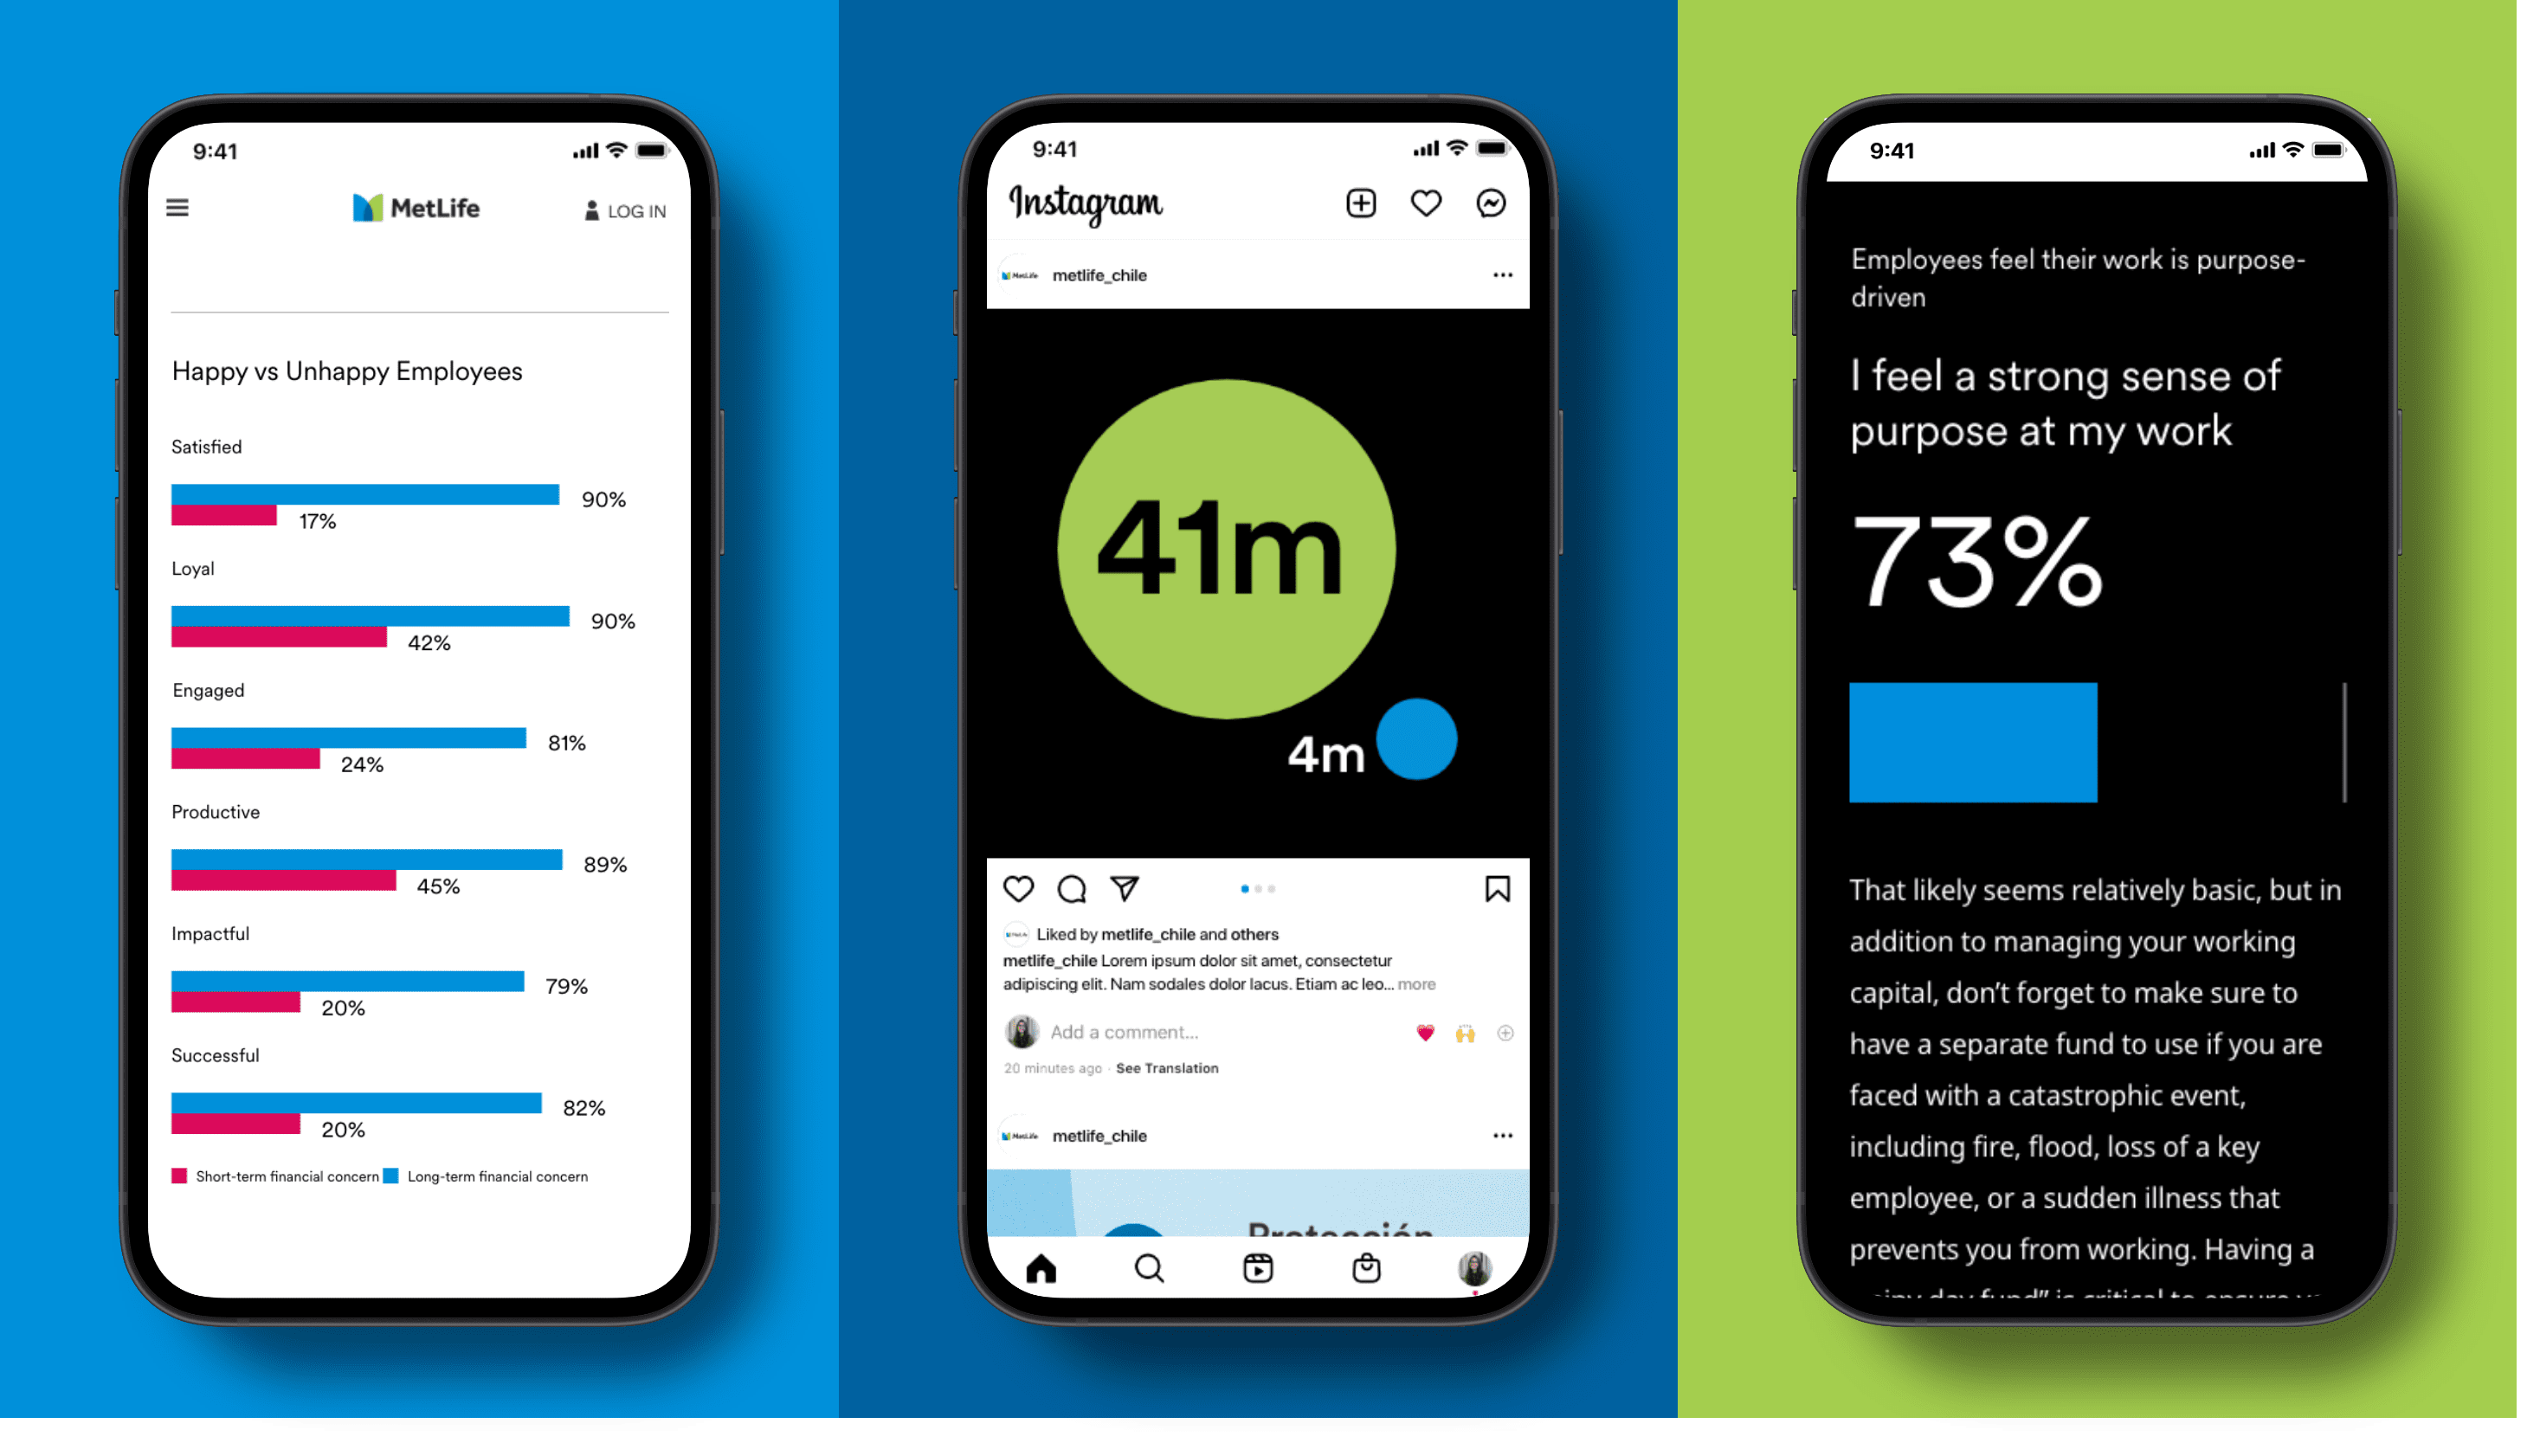
Charts and graphs fall into the data visualization category. They’re great for providing context, making comparisons, or showing progress over time.
Reduce information and focus on the key takeaway.
- Use data to backup and supplement the general content.
- Use visualization in place of extra content (especially text), not in addition to.
Break up blocks of copy with a visualization.
- Data visualizations can help break up a lot of text, especially when visuals like illustrations or photography are not handy.
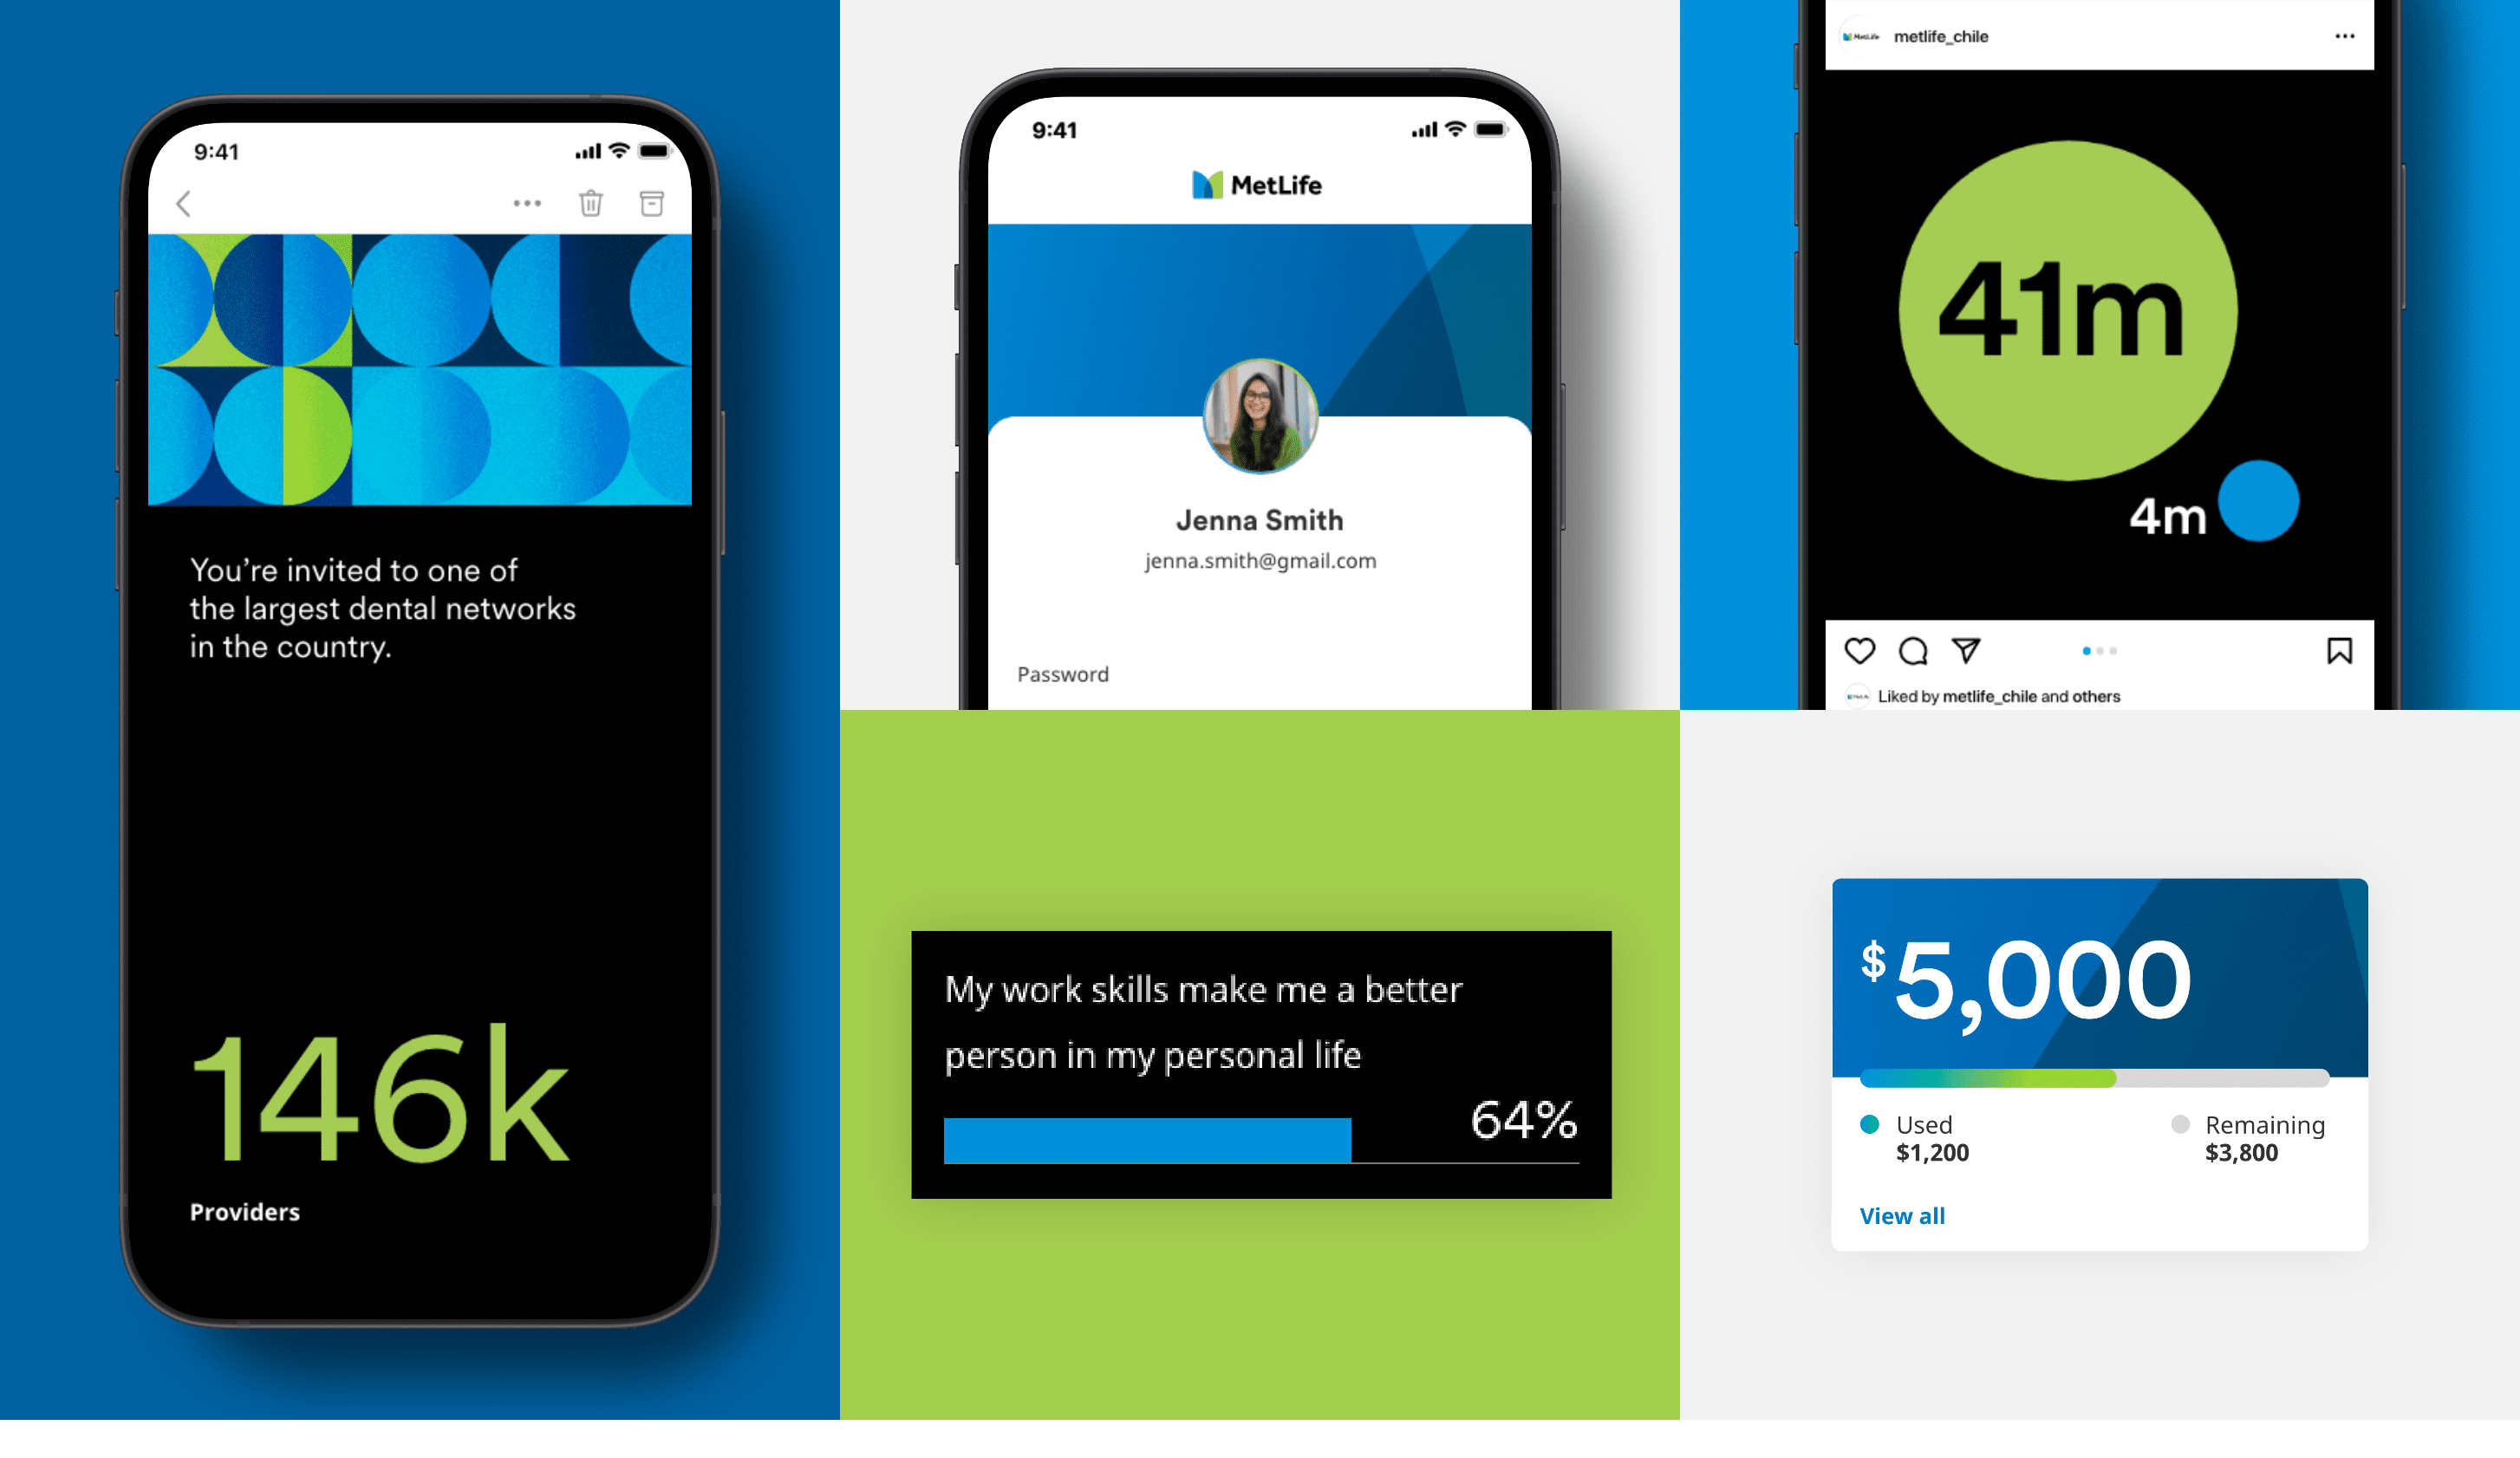
Be bold.
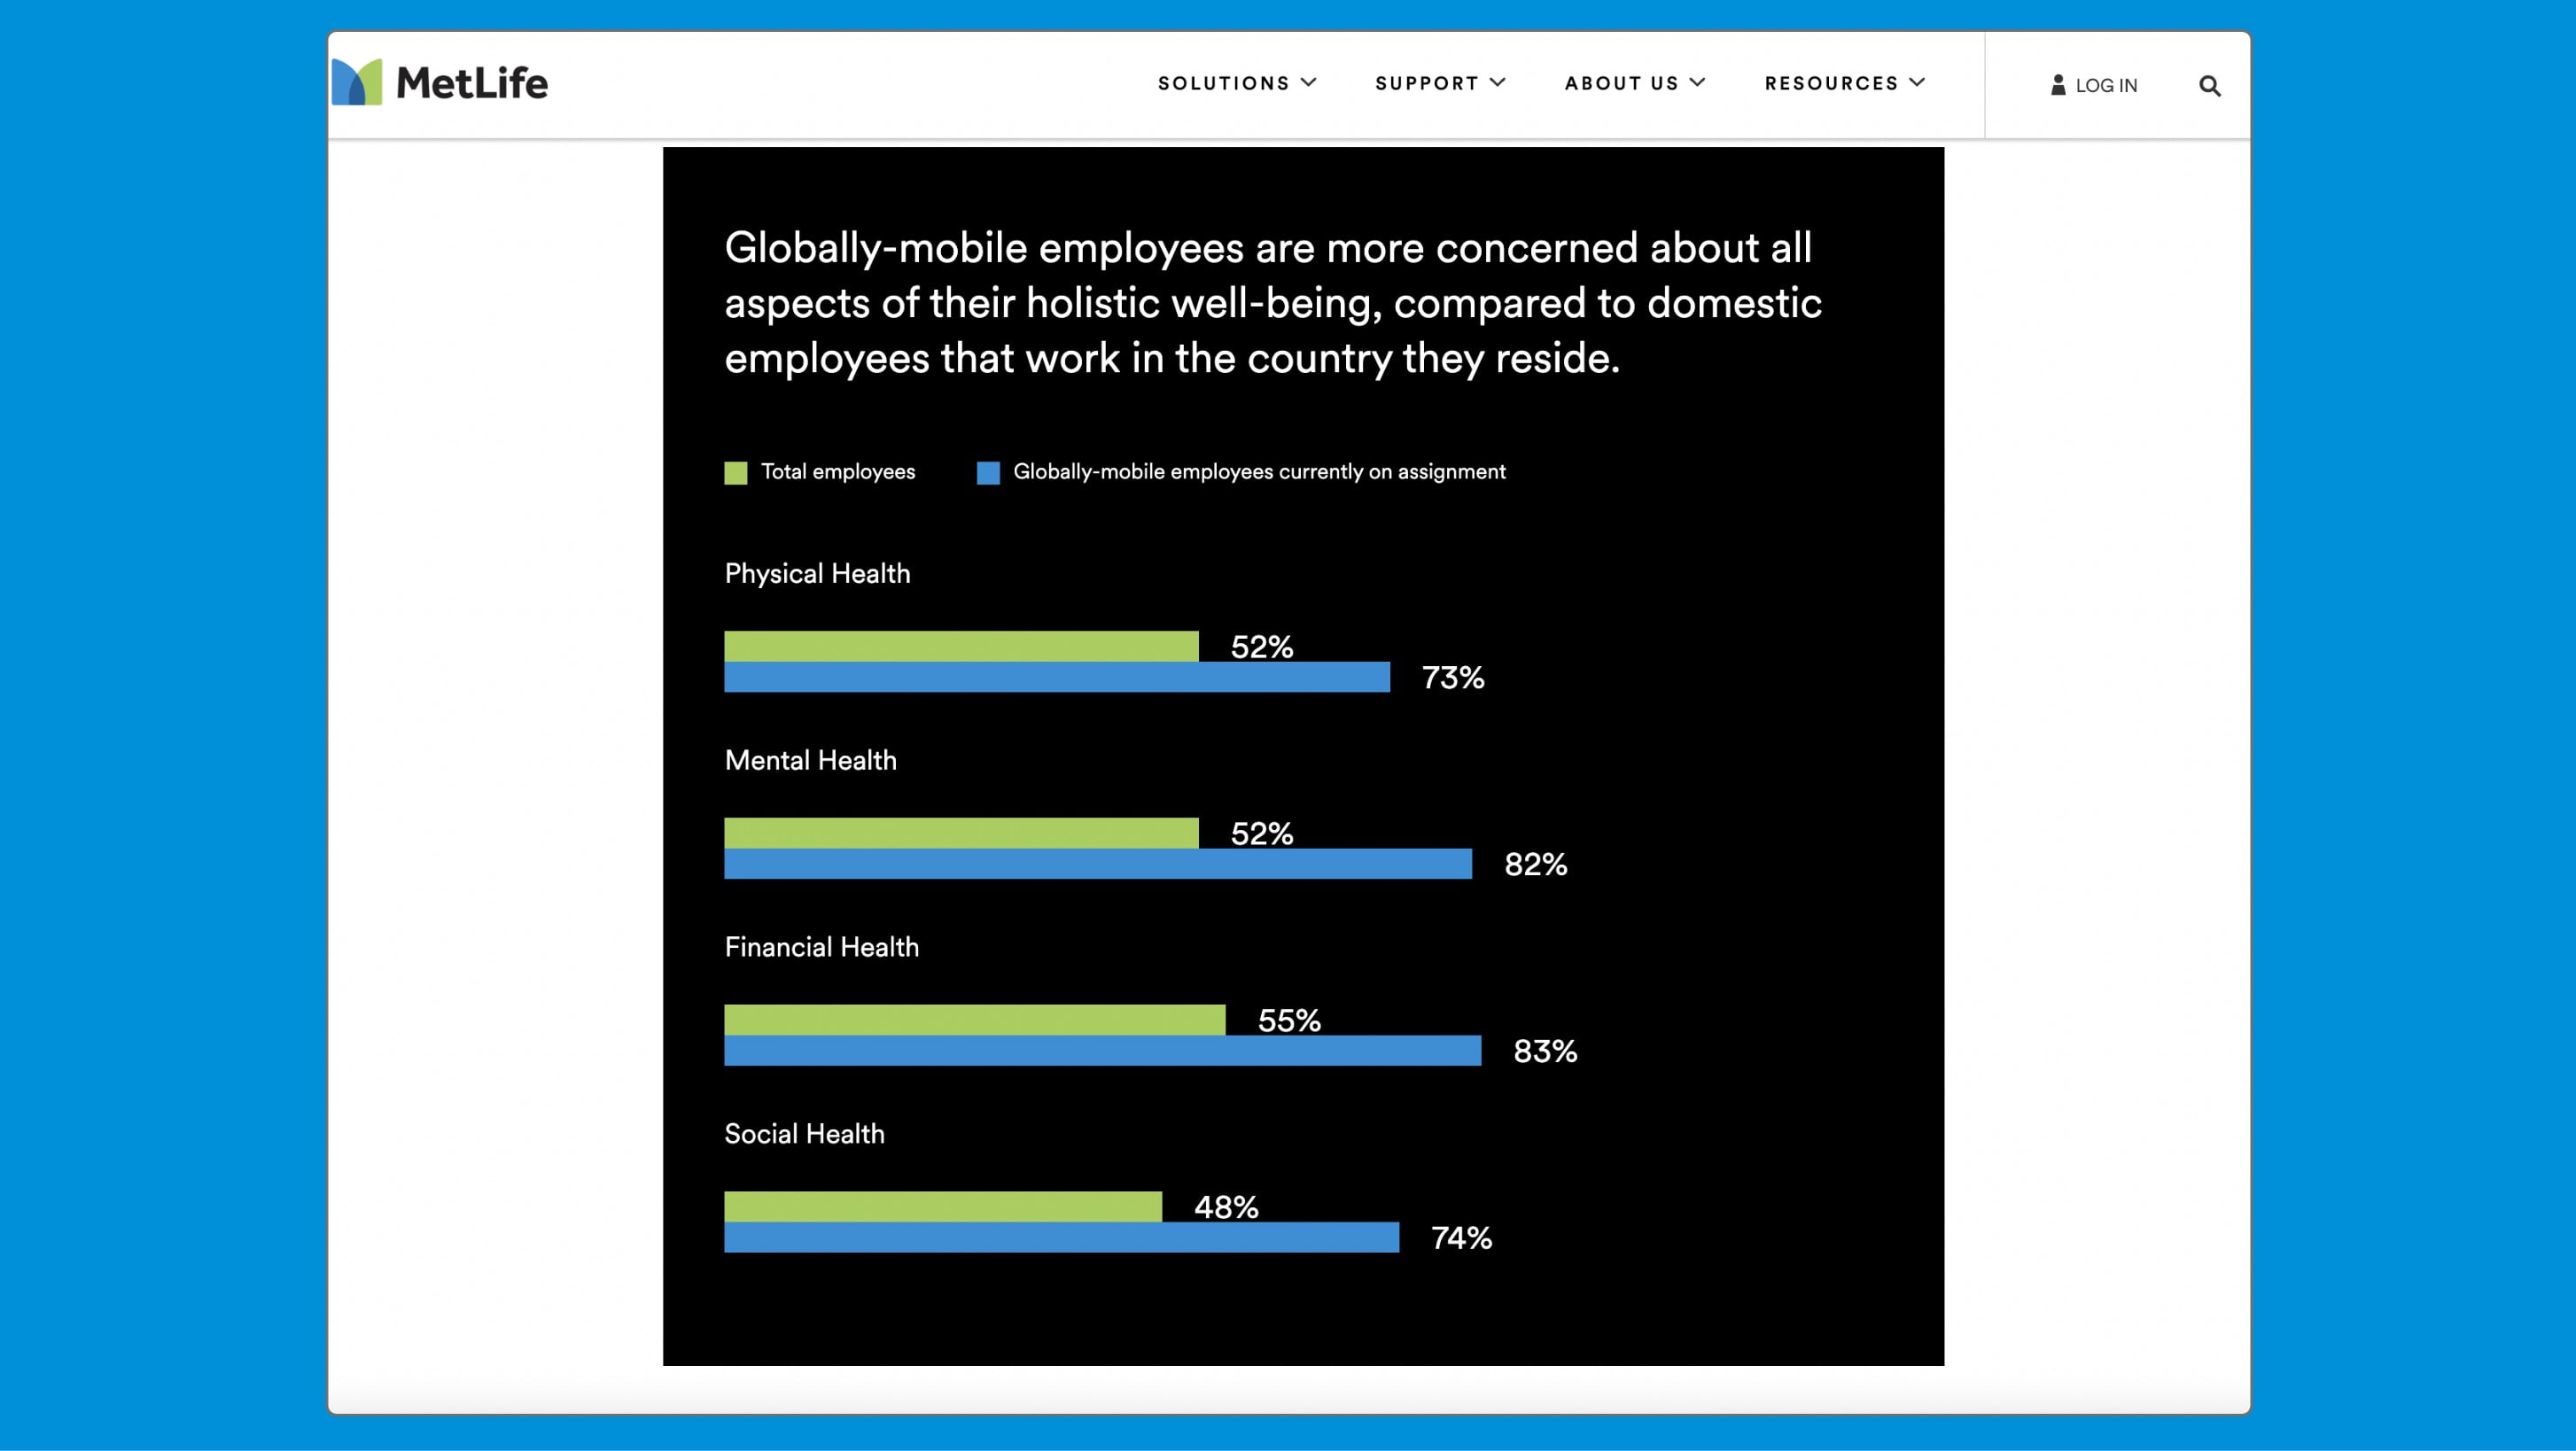
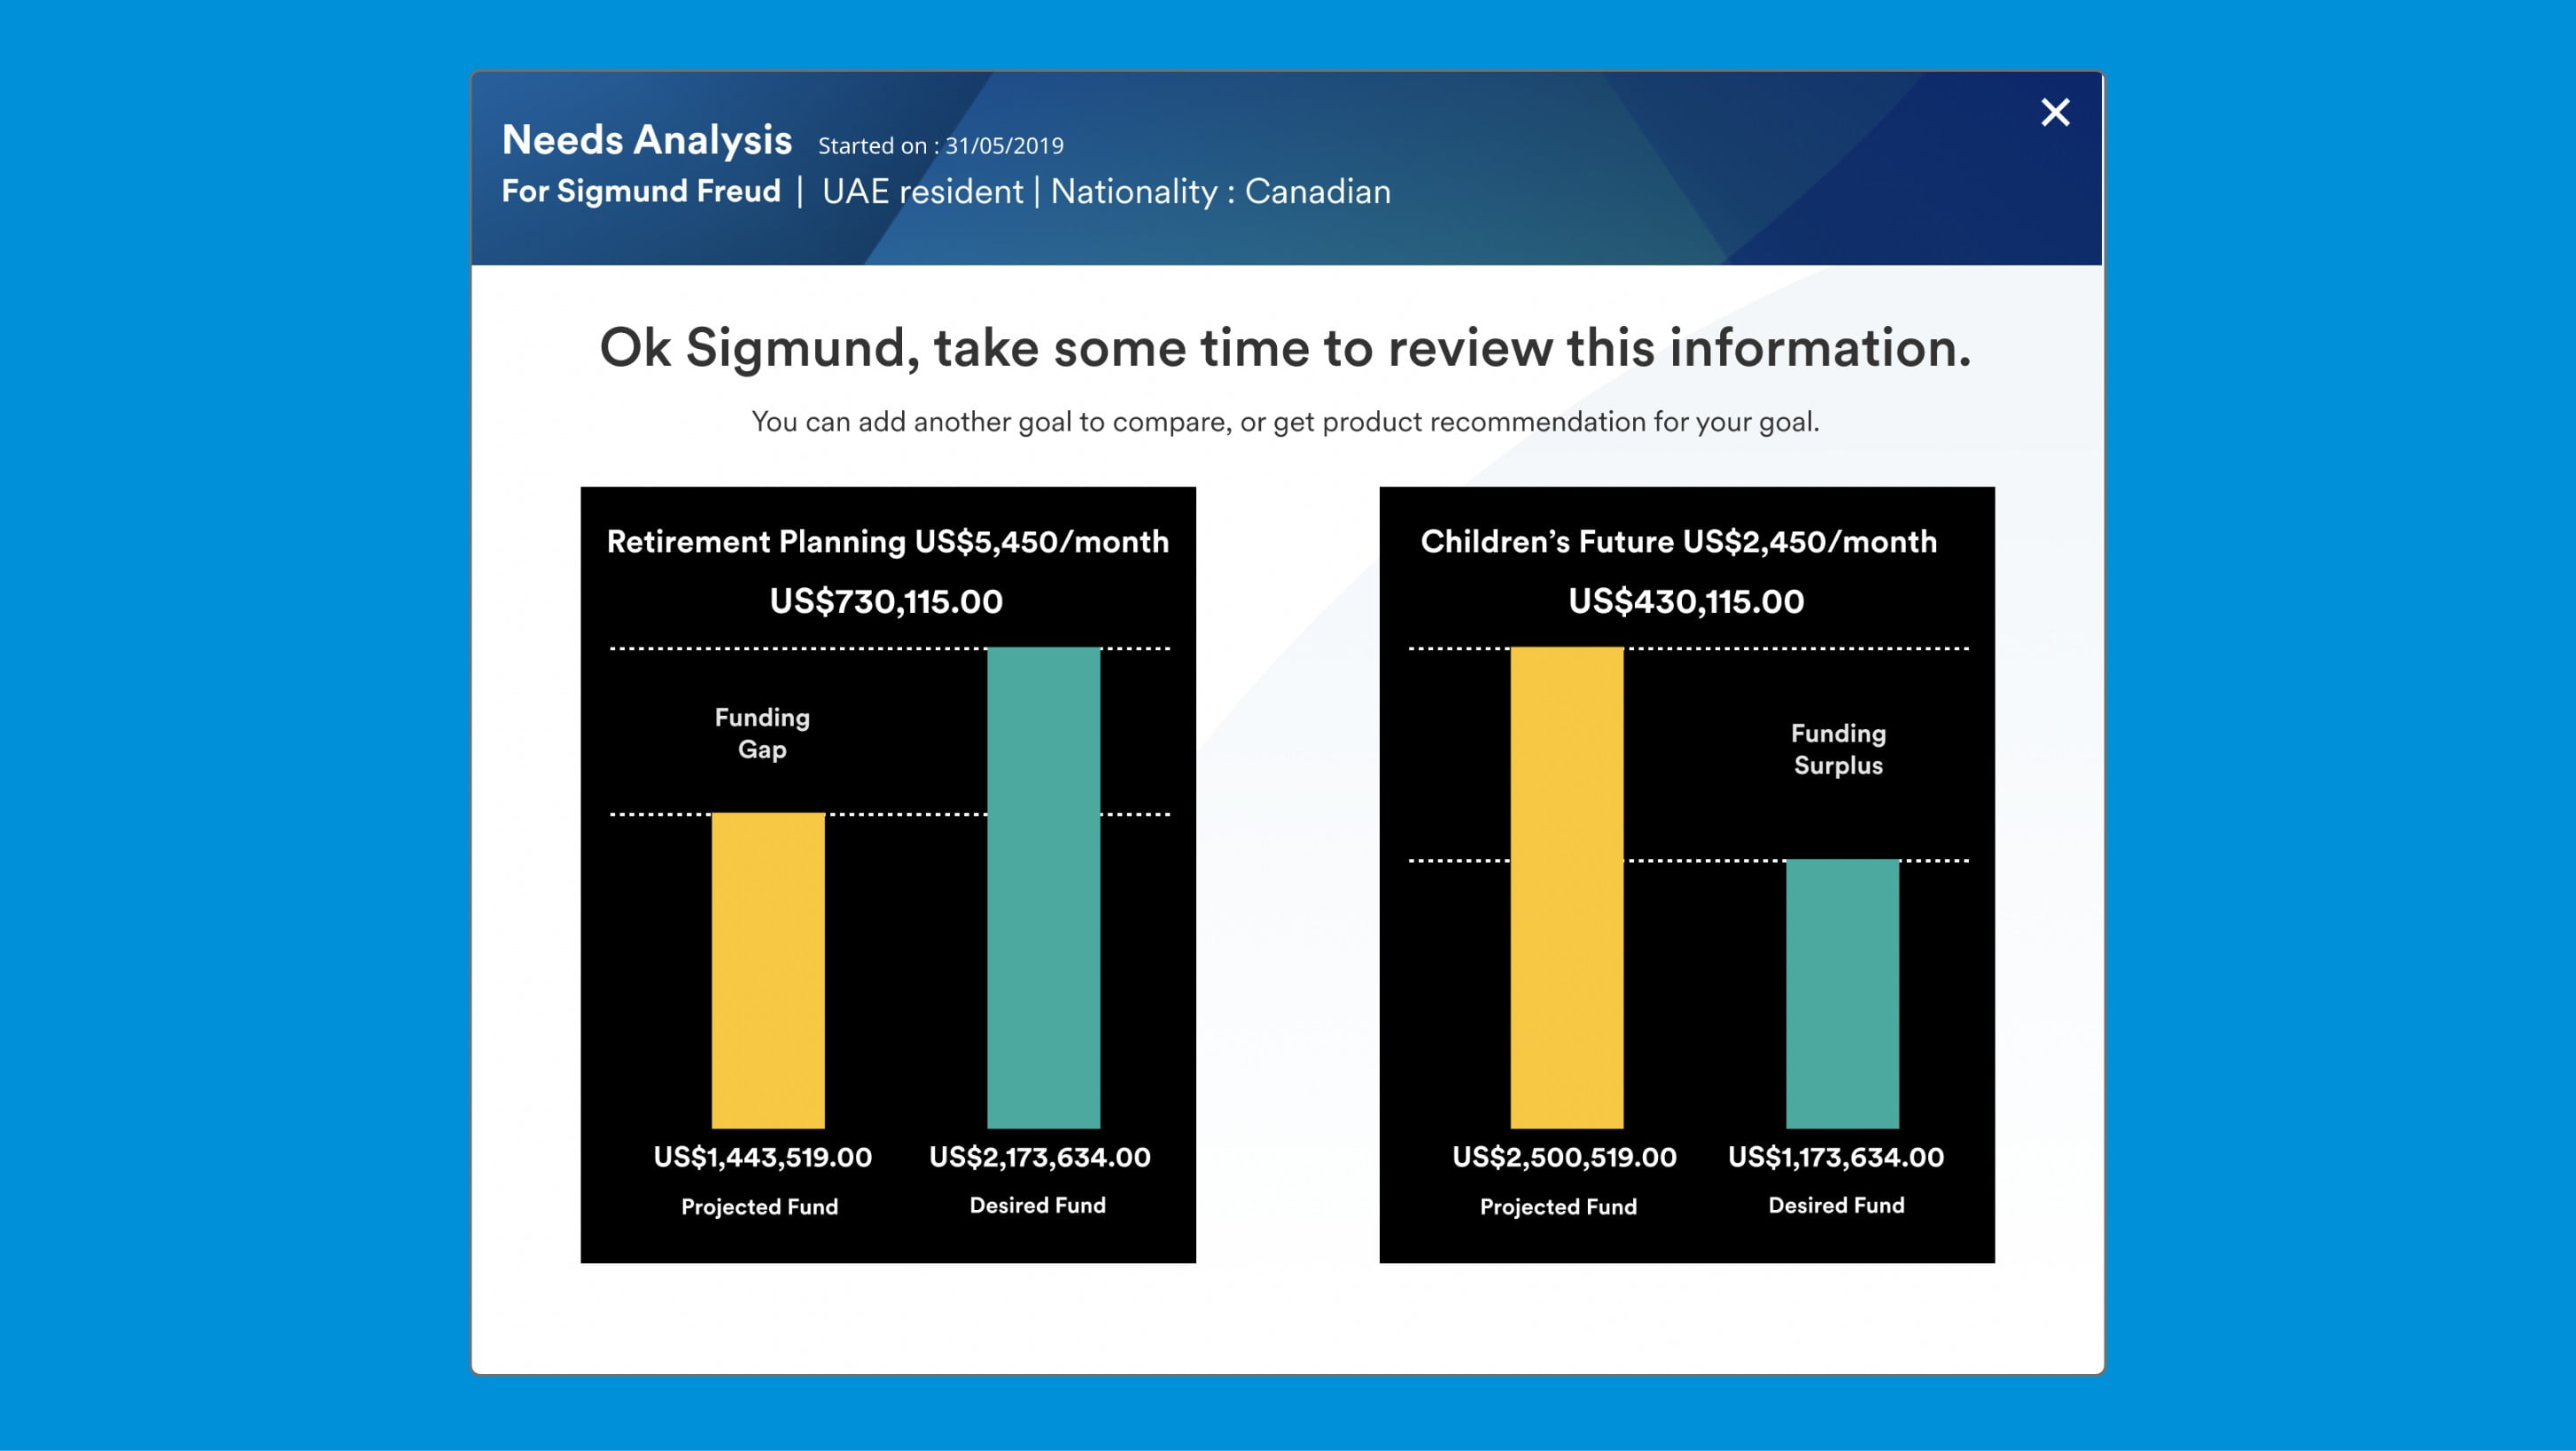
- Use bold, graphic shapes and the primary color palette to focus on the main numeric information.
- Use black as an anchoring color to convey expertise.
- Enlarging numbers by themselves can be an interesting way to represent data.
- Misrepresent data for the sake of visual interest. Make sure the visualization accurately represents the data.
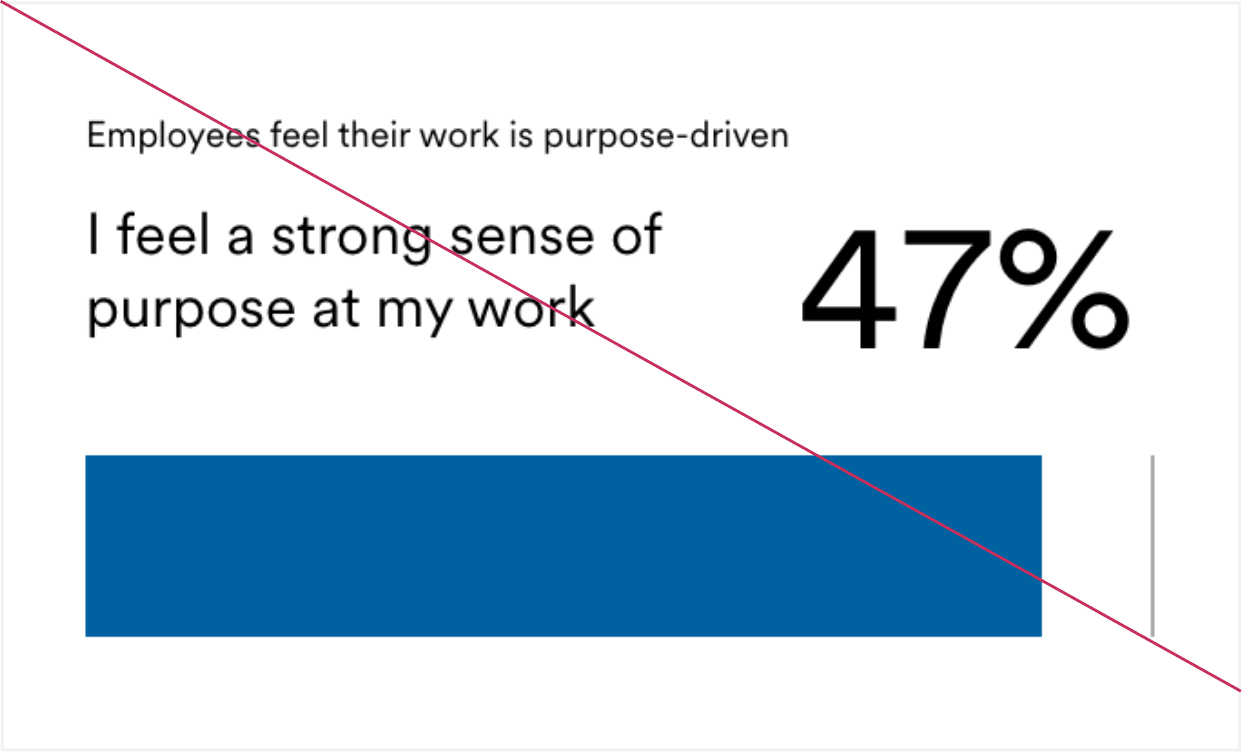
- Create overly complex data visualizations without a focus.
- Use data visualizations in front of busy backgrounds.
- Overwhelm the user with excessive data visuals.
Color & Typography Guidelines
How effectively you can use our colors and typography in data visualization.
Color
Color is a major factor in creating effective charts. A good set of colors will represent the story you want the data to tell, and not hide or distract from a visualization’s purpose. While choosing color for your data visualization keep the purpose, clarity and accessibility aspects in mind. Below we have palletes created by various usage and data points as a guideline.
Pallete 1 (Basic)
Base Pallete with Accent Colors.
Pallete 2 (Extended)
For complex data visualizations, an extended color palette can allow the data to be presented in a clear and meaningful way. However, it’s important to note that a larger color palette doesn’t necessarily mean to use all available colors. We encourage you to choose colors that are effective in conveying the intended message of the visualization, keeping in mind to add enough contrast between colors adjacent to each other. Additionally, the black and white colors are dependent on the type of background color used (light/dark) to ensure these colors are rendered properly.
Typography
For data visualization on page, use our standard two sans serif typefaces - MetLife Circular© and Noto Sans. Similar to UI standards, data visualization follows typography hierarchy rules by using MetLife Circular© for headers and sub headers. For all other labels and values use Noto Sans. Keep in mind your page typography hierarchy when inserting data visualization while providing headers and subheaders style.
Use MetLife Circular© as our primary brand font.
- Use MetLife Circular© in your data visualization for headers, sub headers and to highlight any main data points.
Use Noto Sans as a secondary font
- Use Noto Sans in your data visualization for labels, legends, descriptions, source etc. You can use font weight and body copy font sizes to highlight some of these elements more over other to create typography hierarchy.
Types & Usage
There are various types of charts and graphs to choose from. Depending on data and where in your layout it will appear, you can choose type and size of chart, some of the examples are provided below.
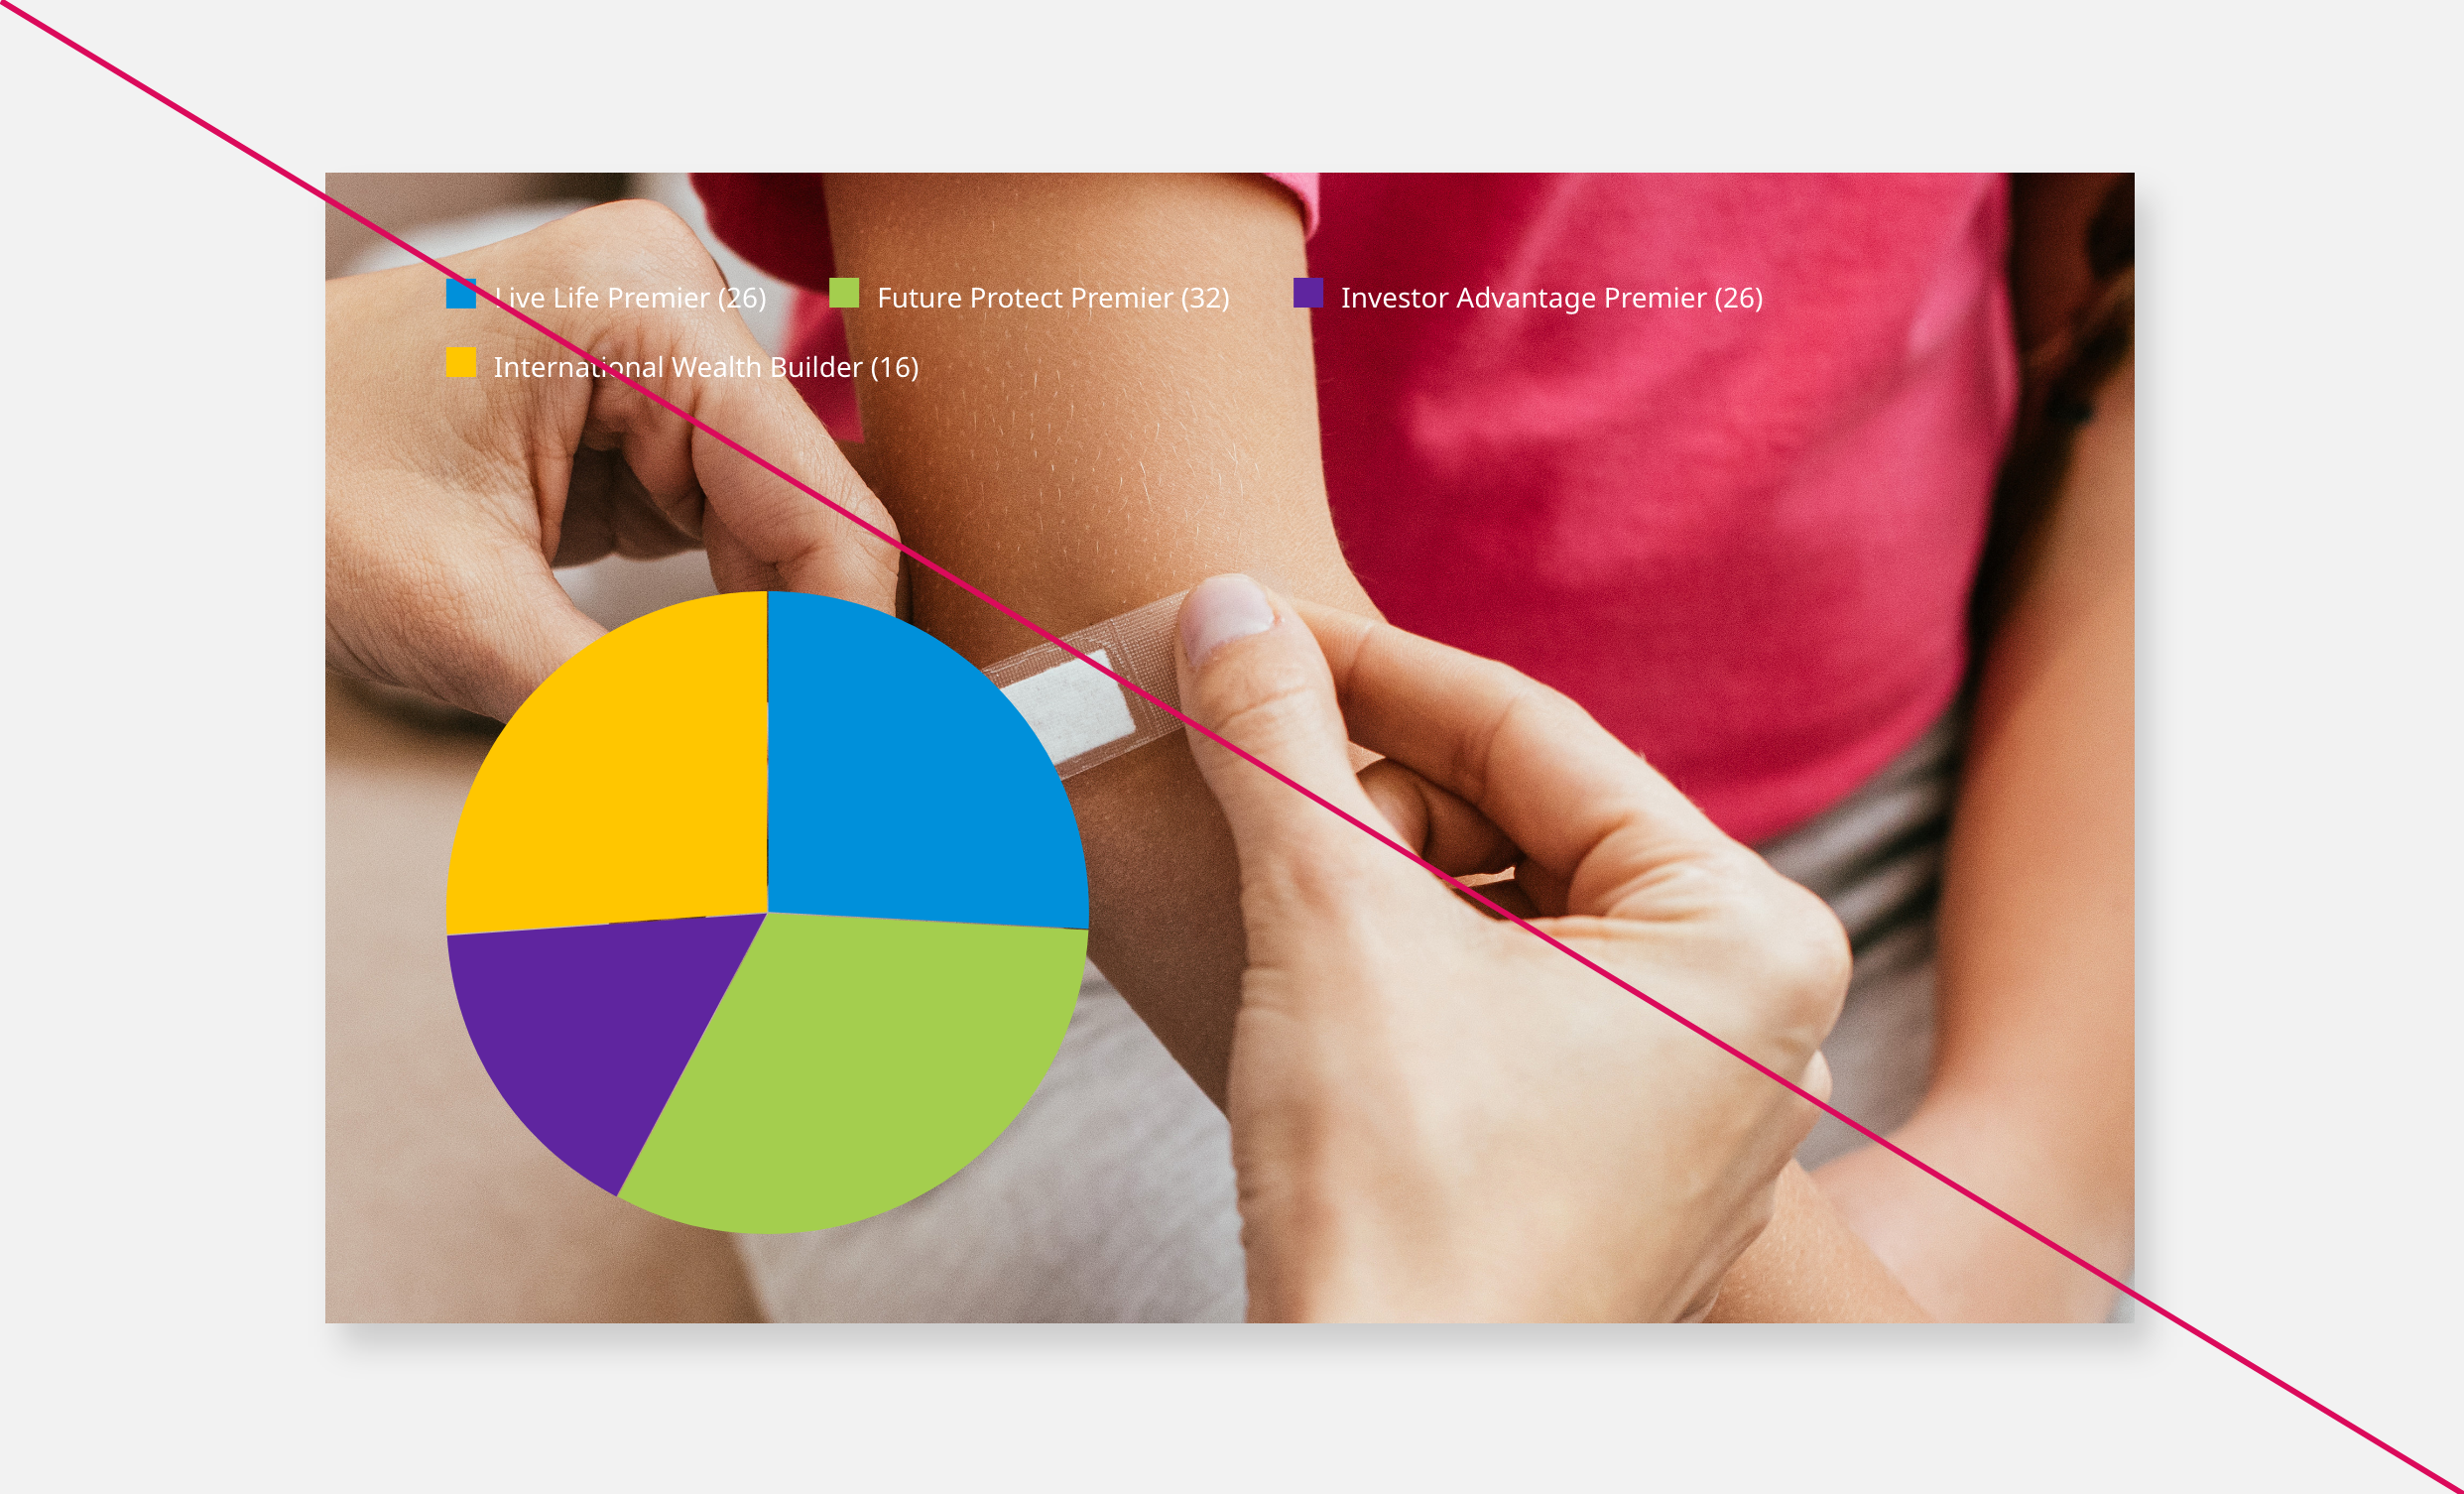
Simple Data - Ideal for small to medium screen space
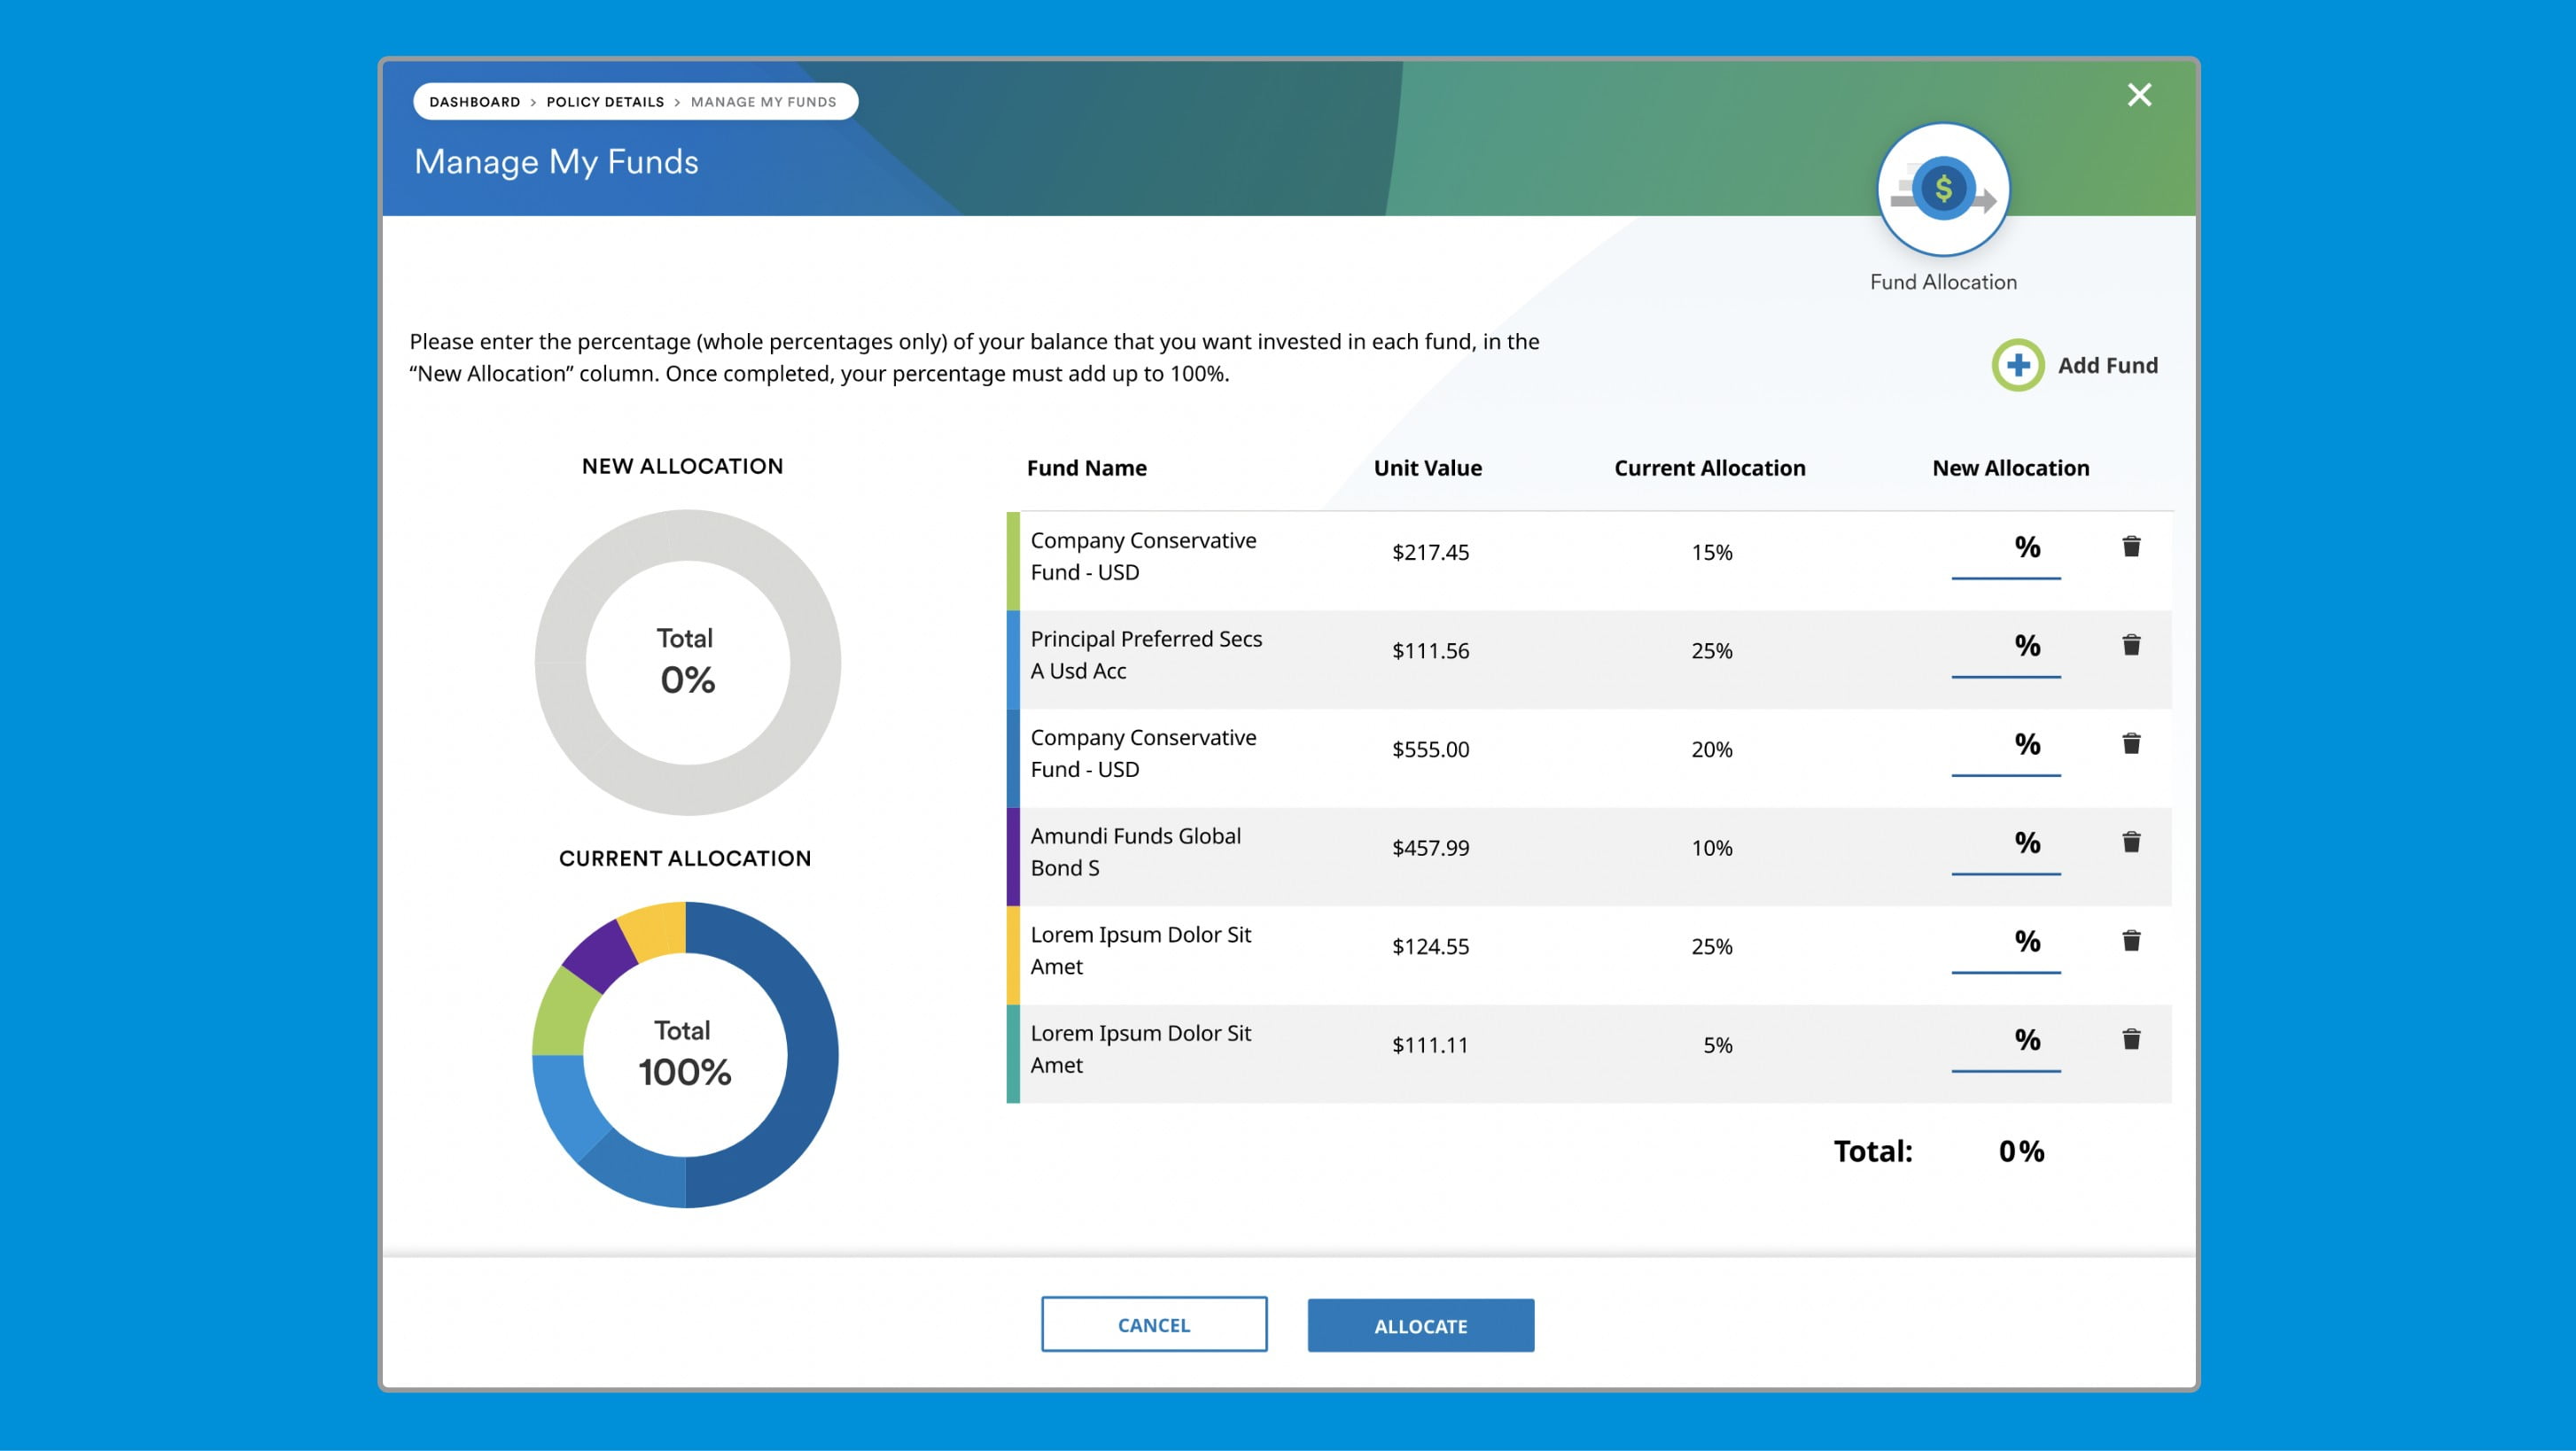
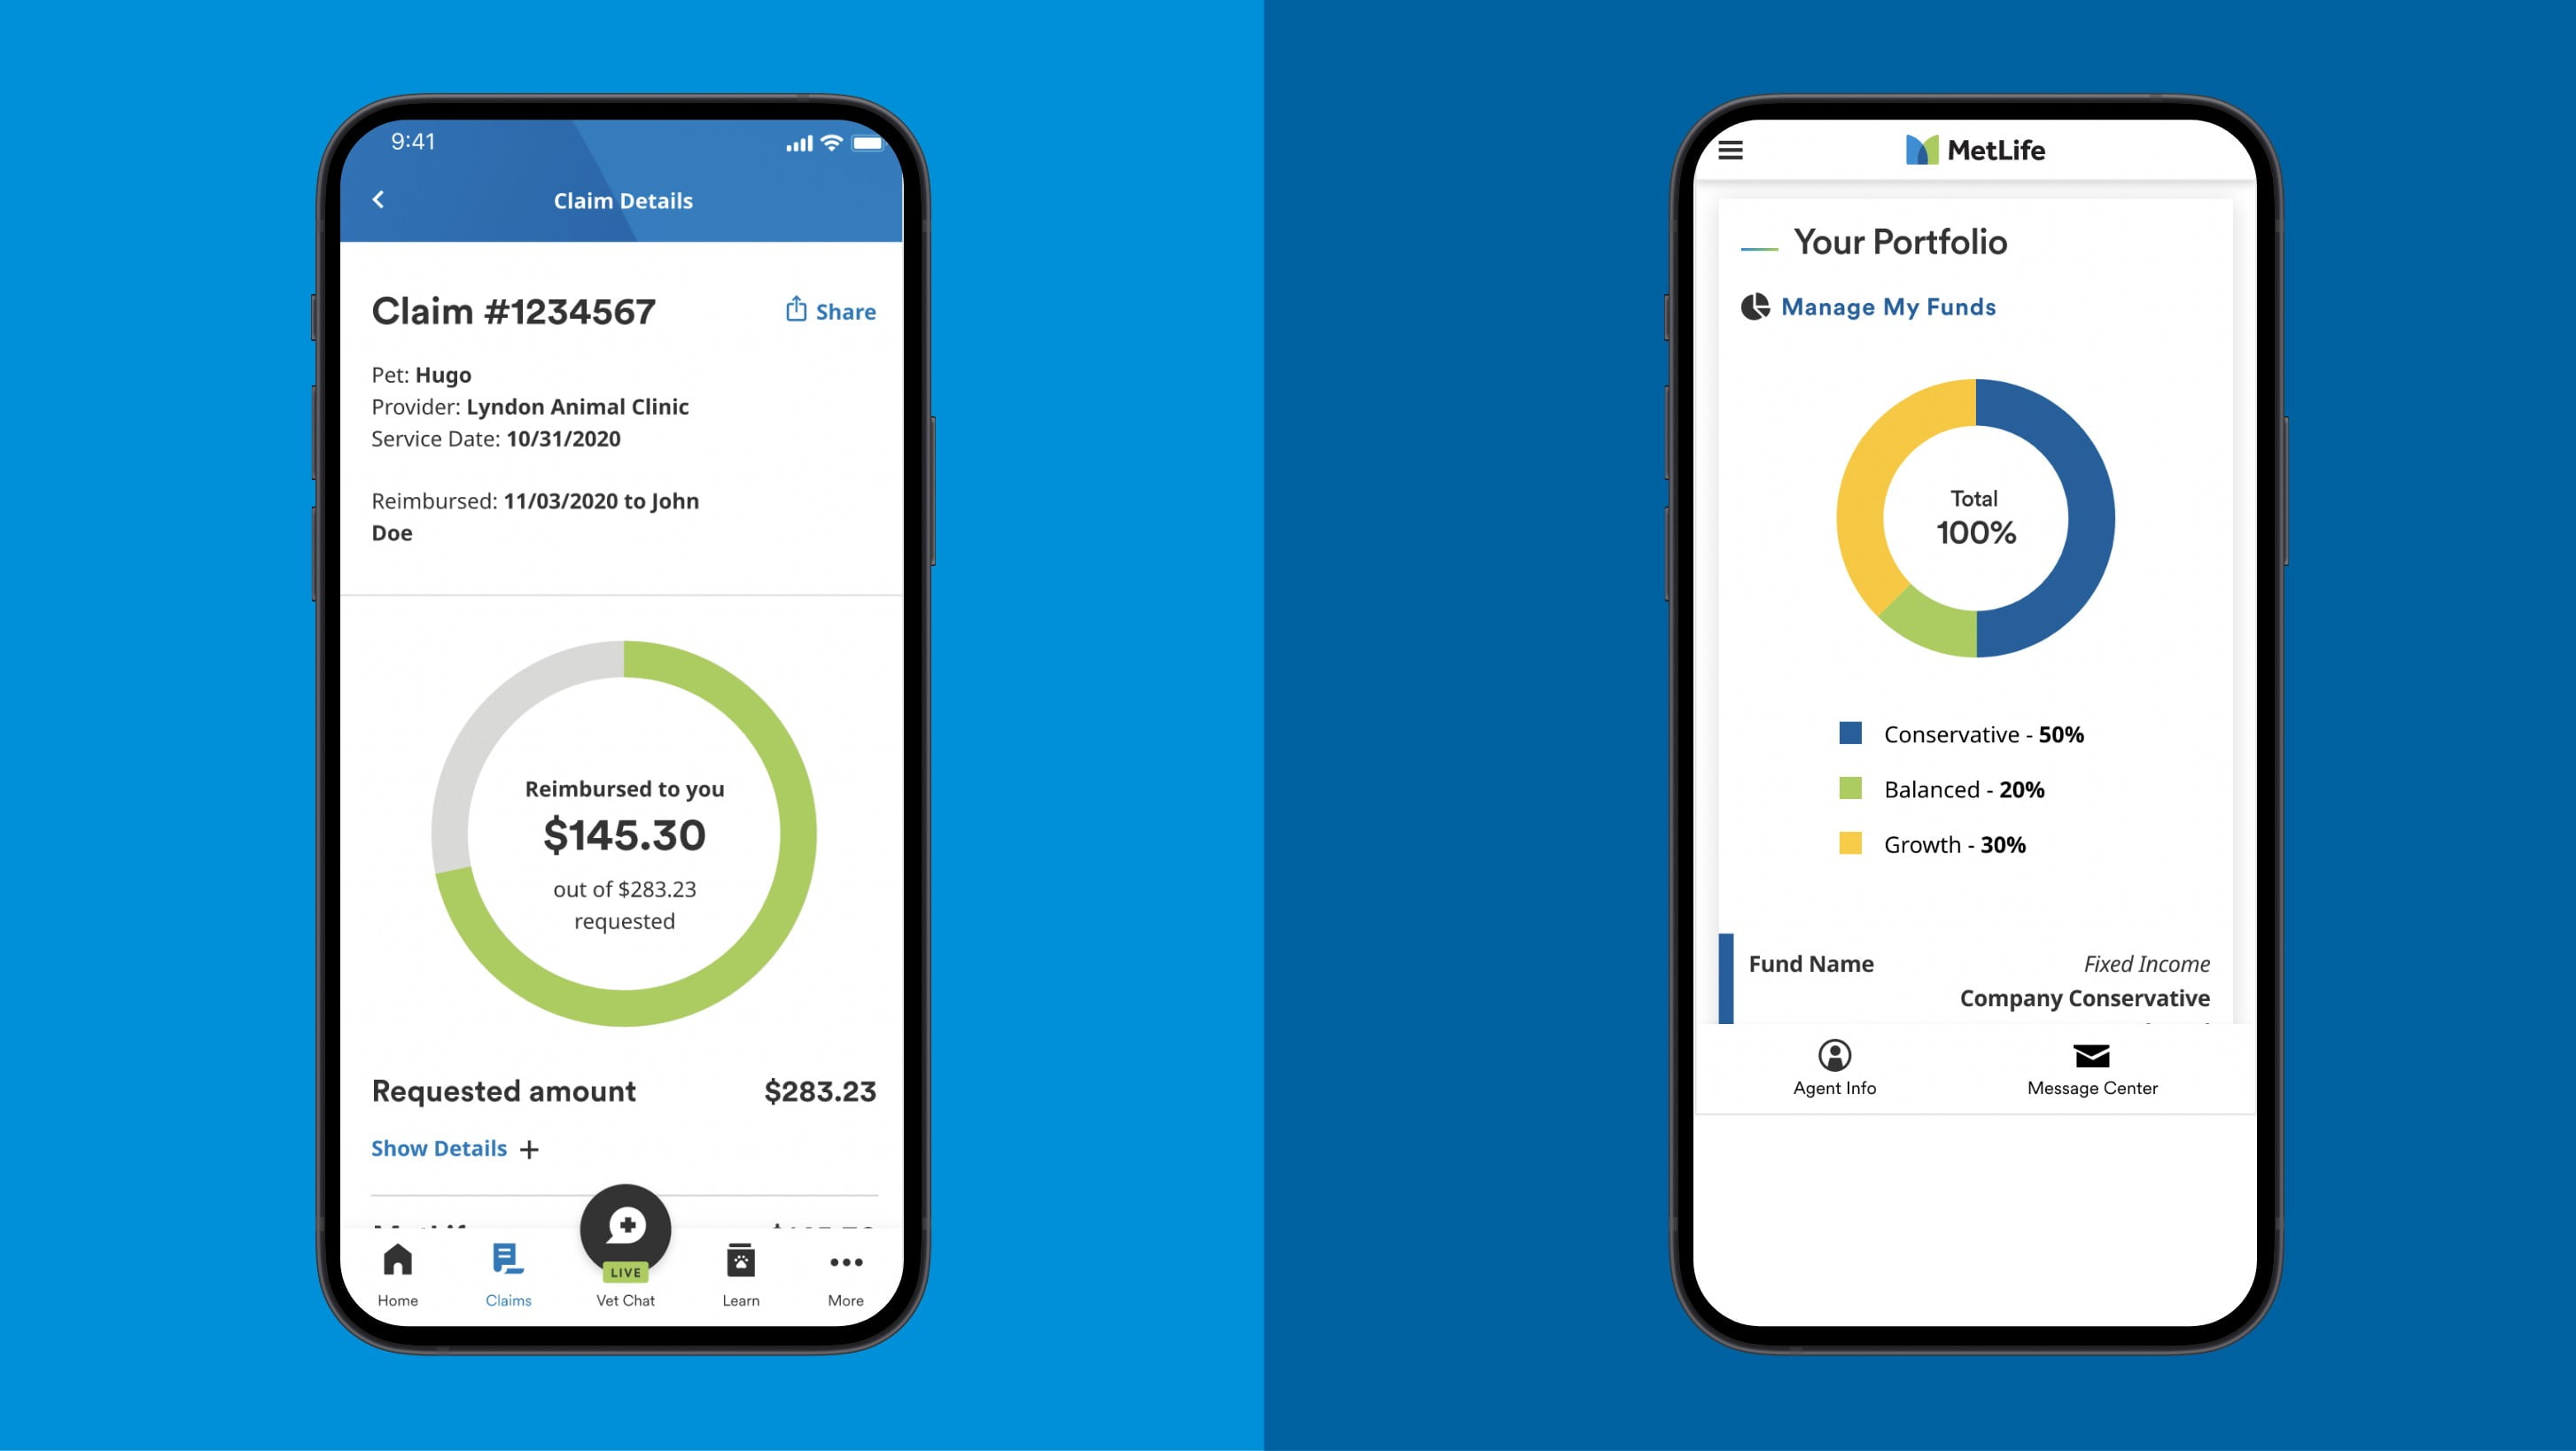
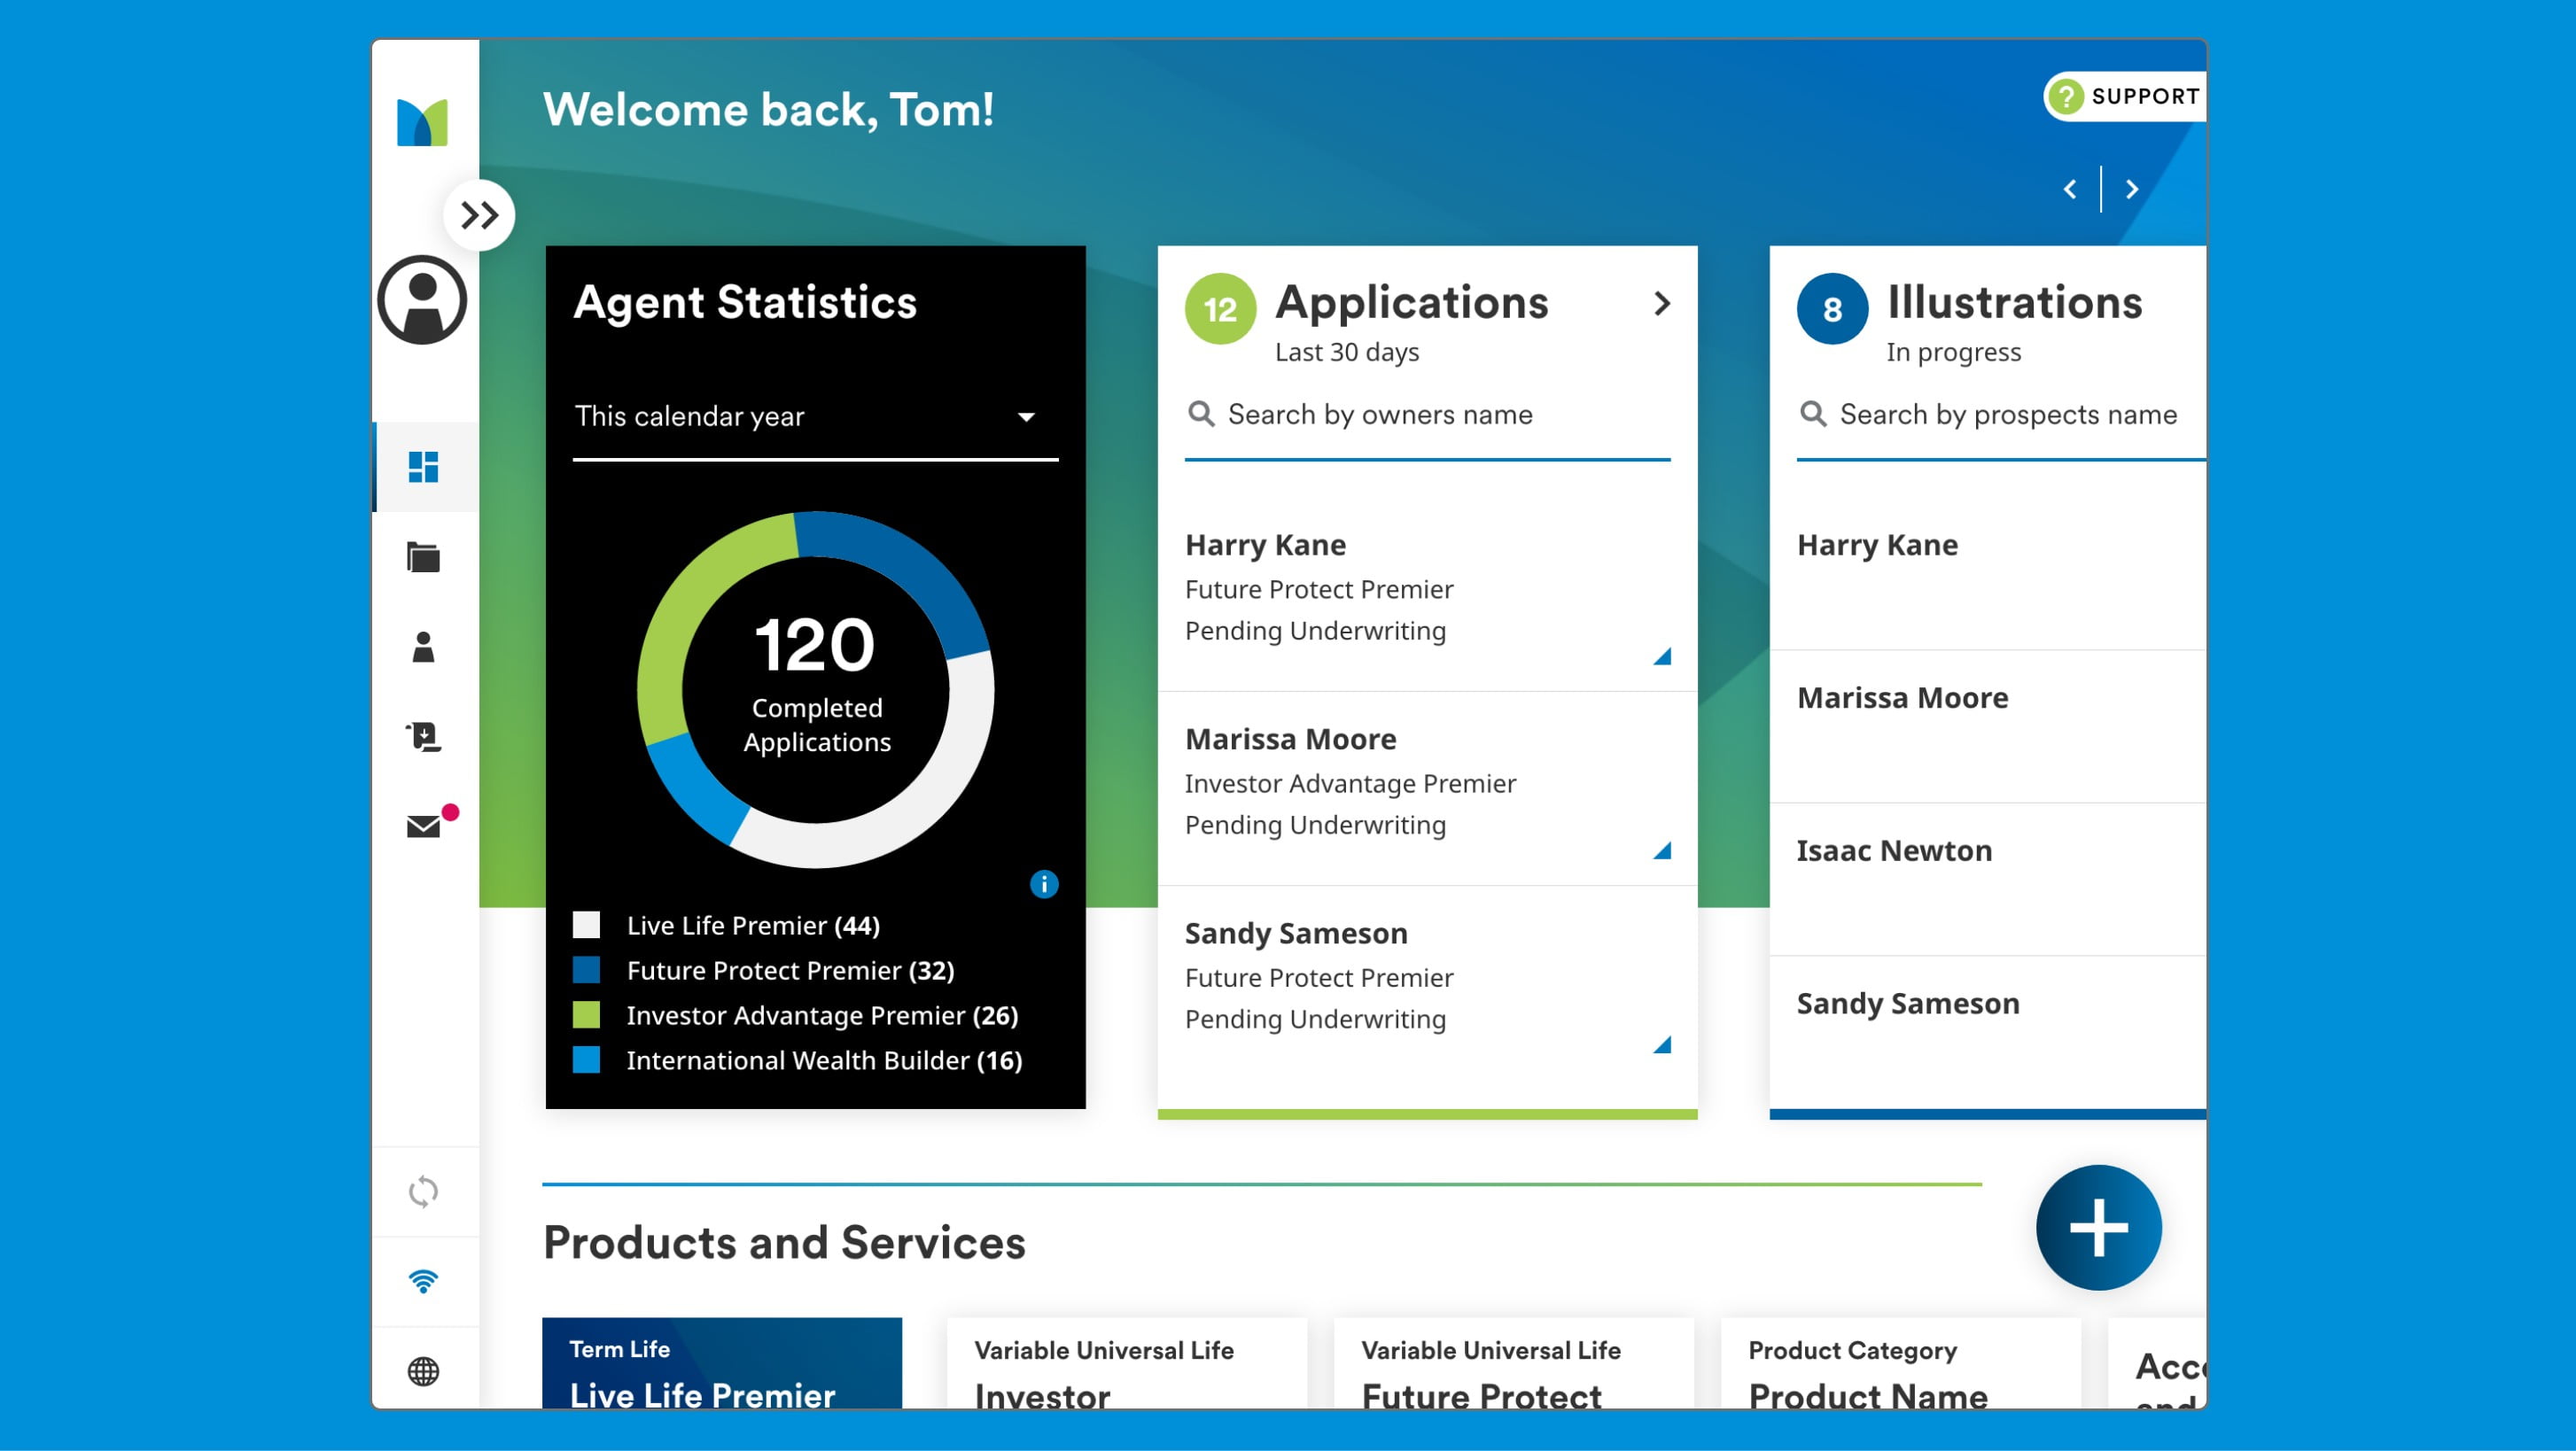
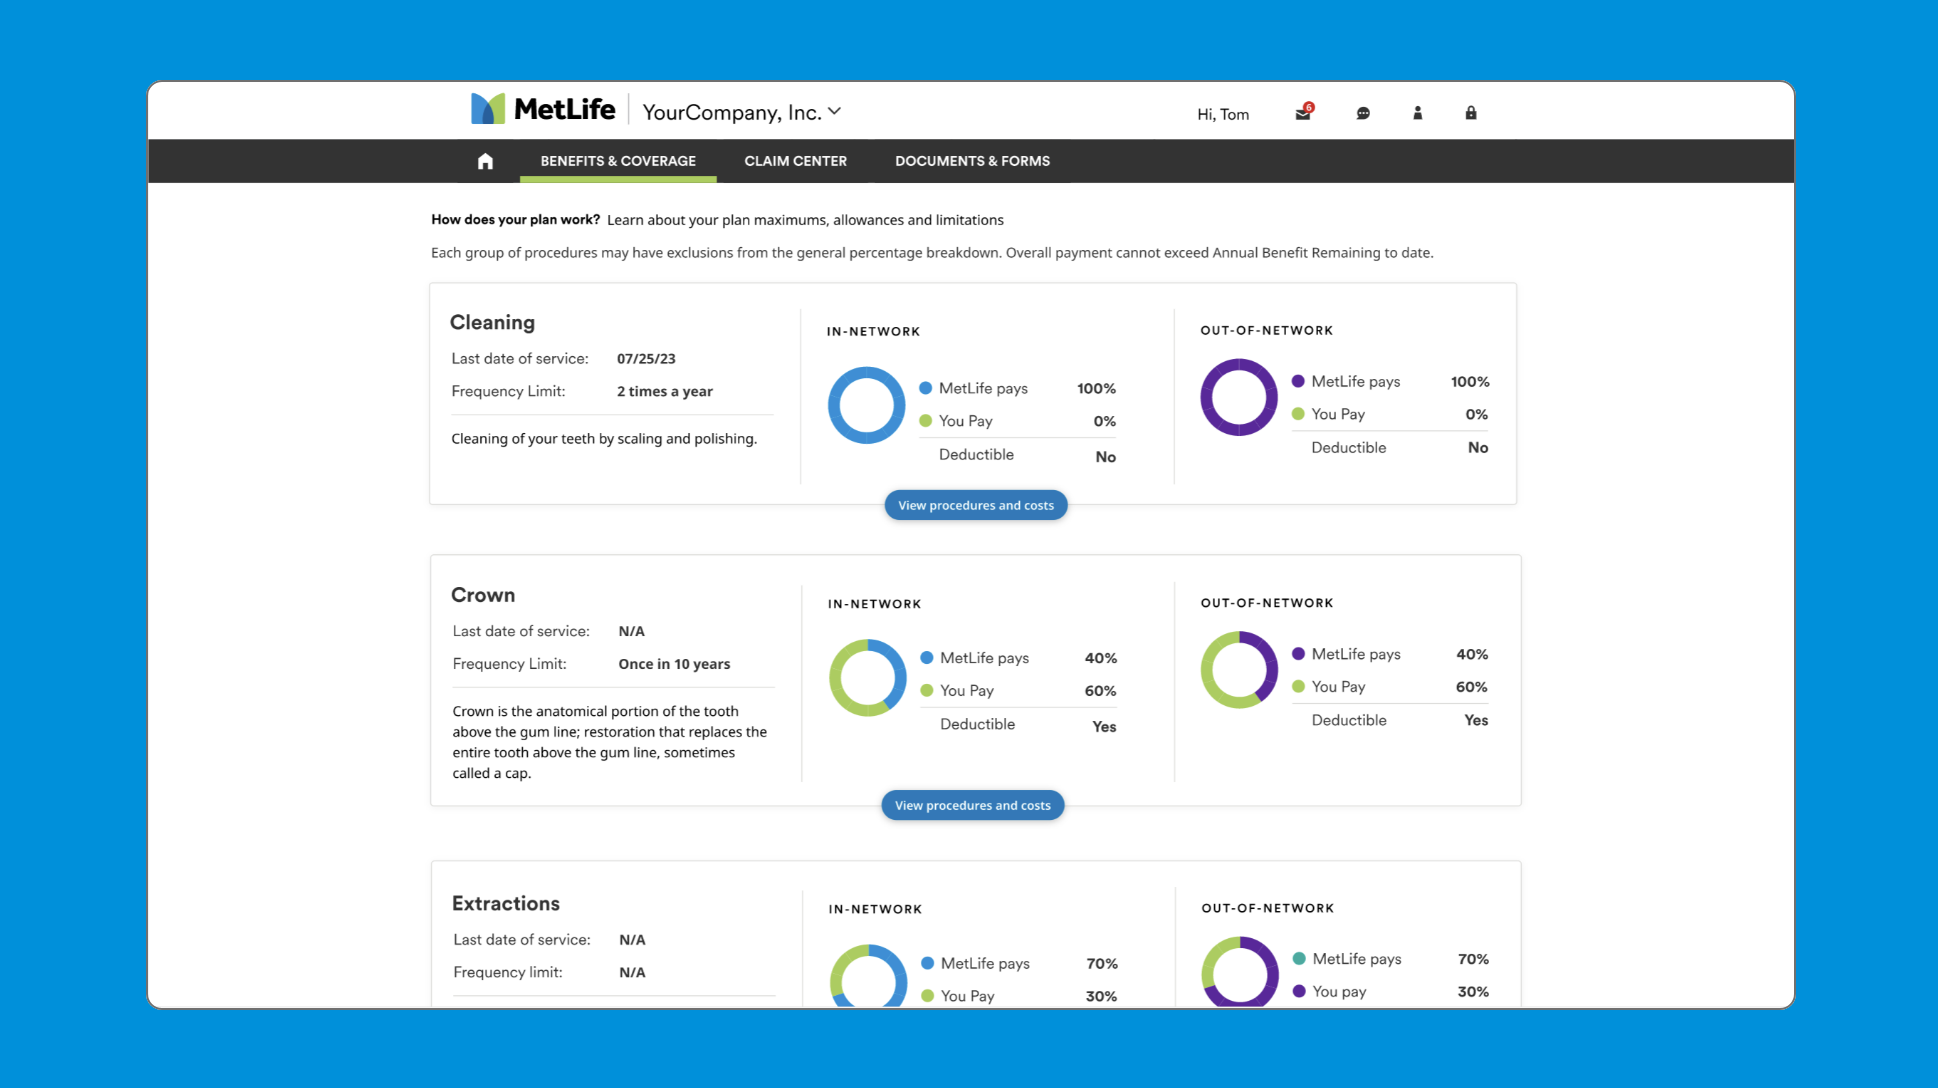
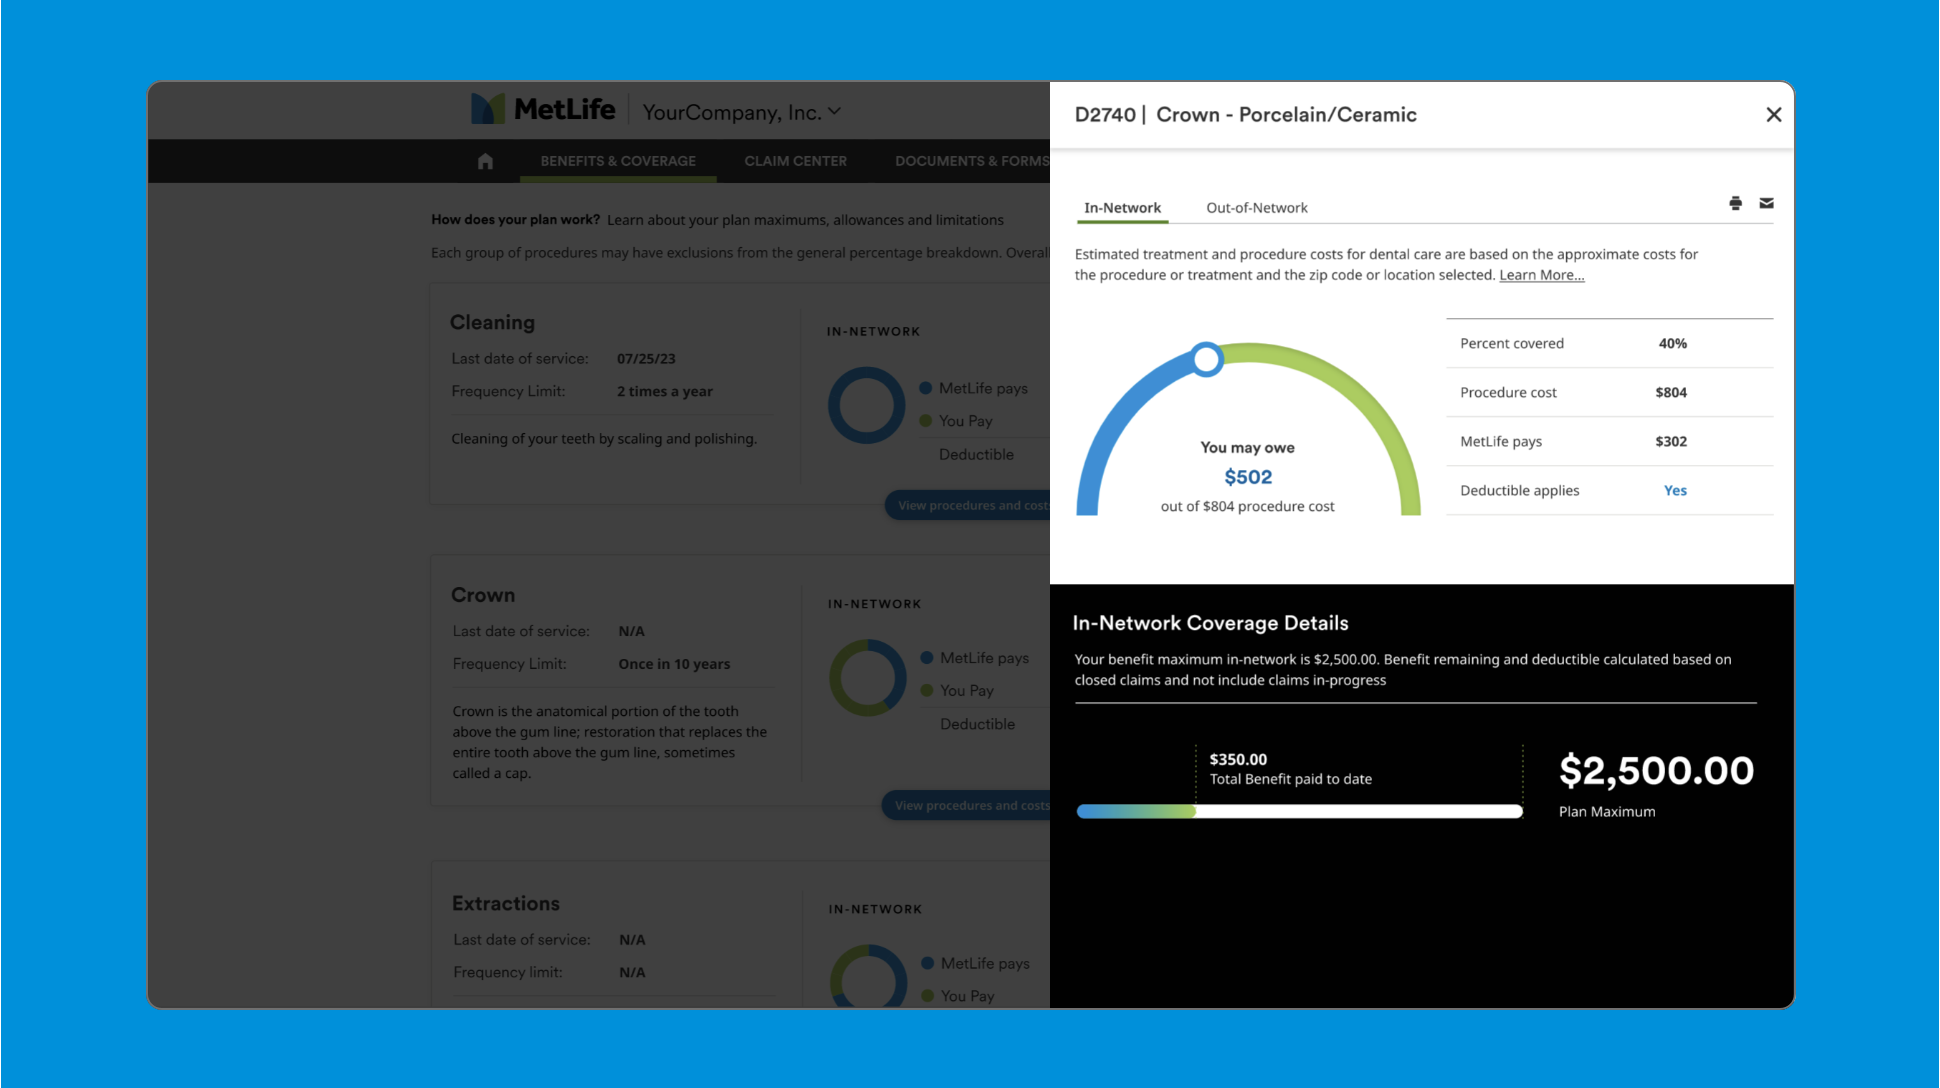
Pie or donut chart works well in smaller space, hence ideal to display on dashboard card, mobile screens or when want to compare multiple data sets side by side. You can use a pie chart when you have a single data series with only positive values. You can use a donut chart when you have a single data series that includes negative values.
Some use cases include:
- Current and future allocation
- Beneficiary Distribution
- Claim Reimbursement
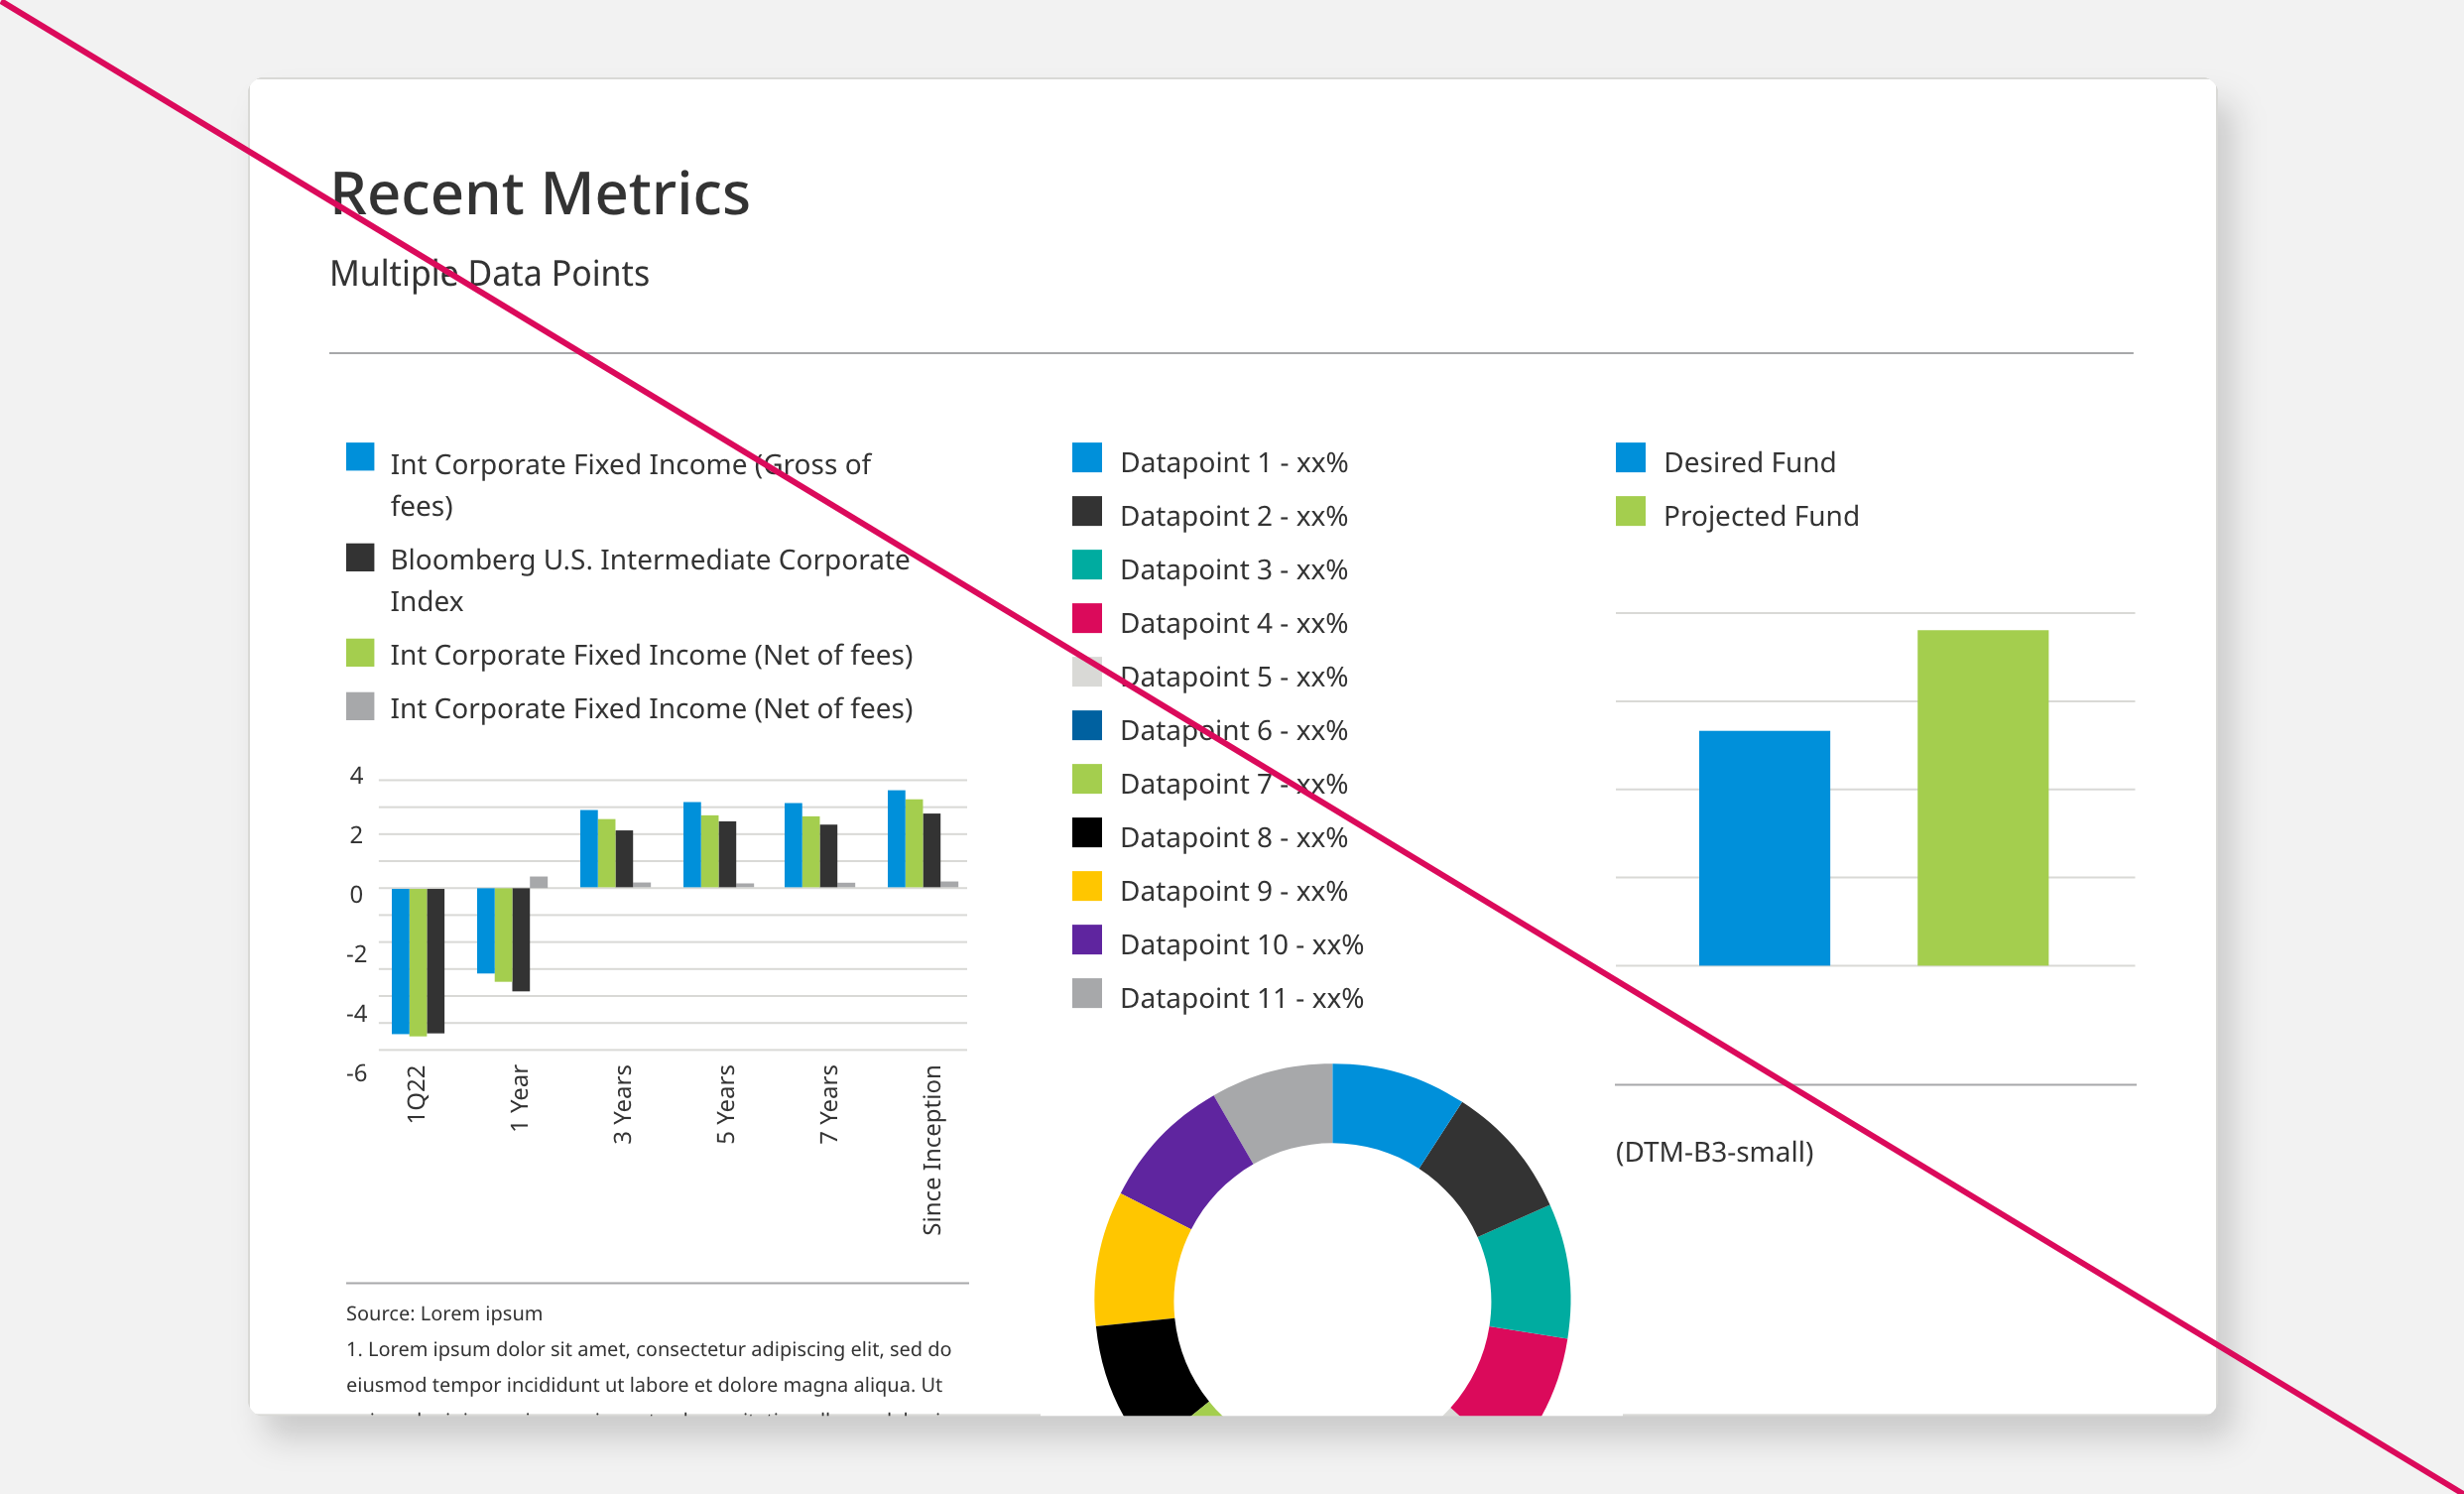
Simple to Medium Data - Ideal for large, medium or small screen space
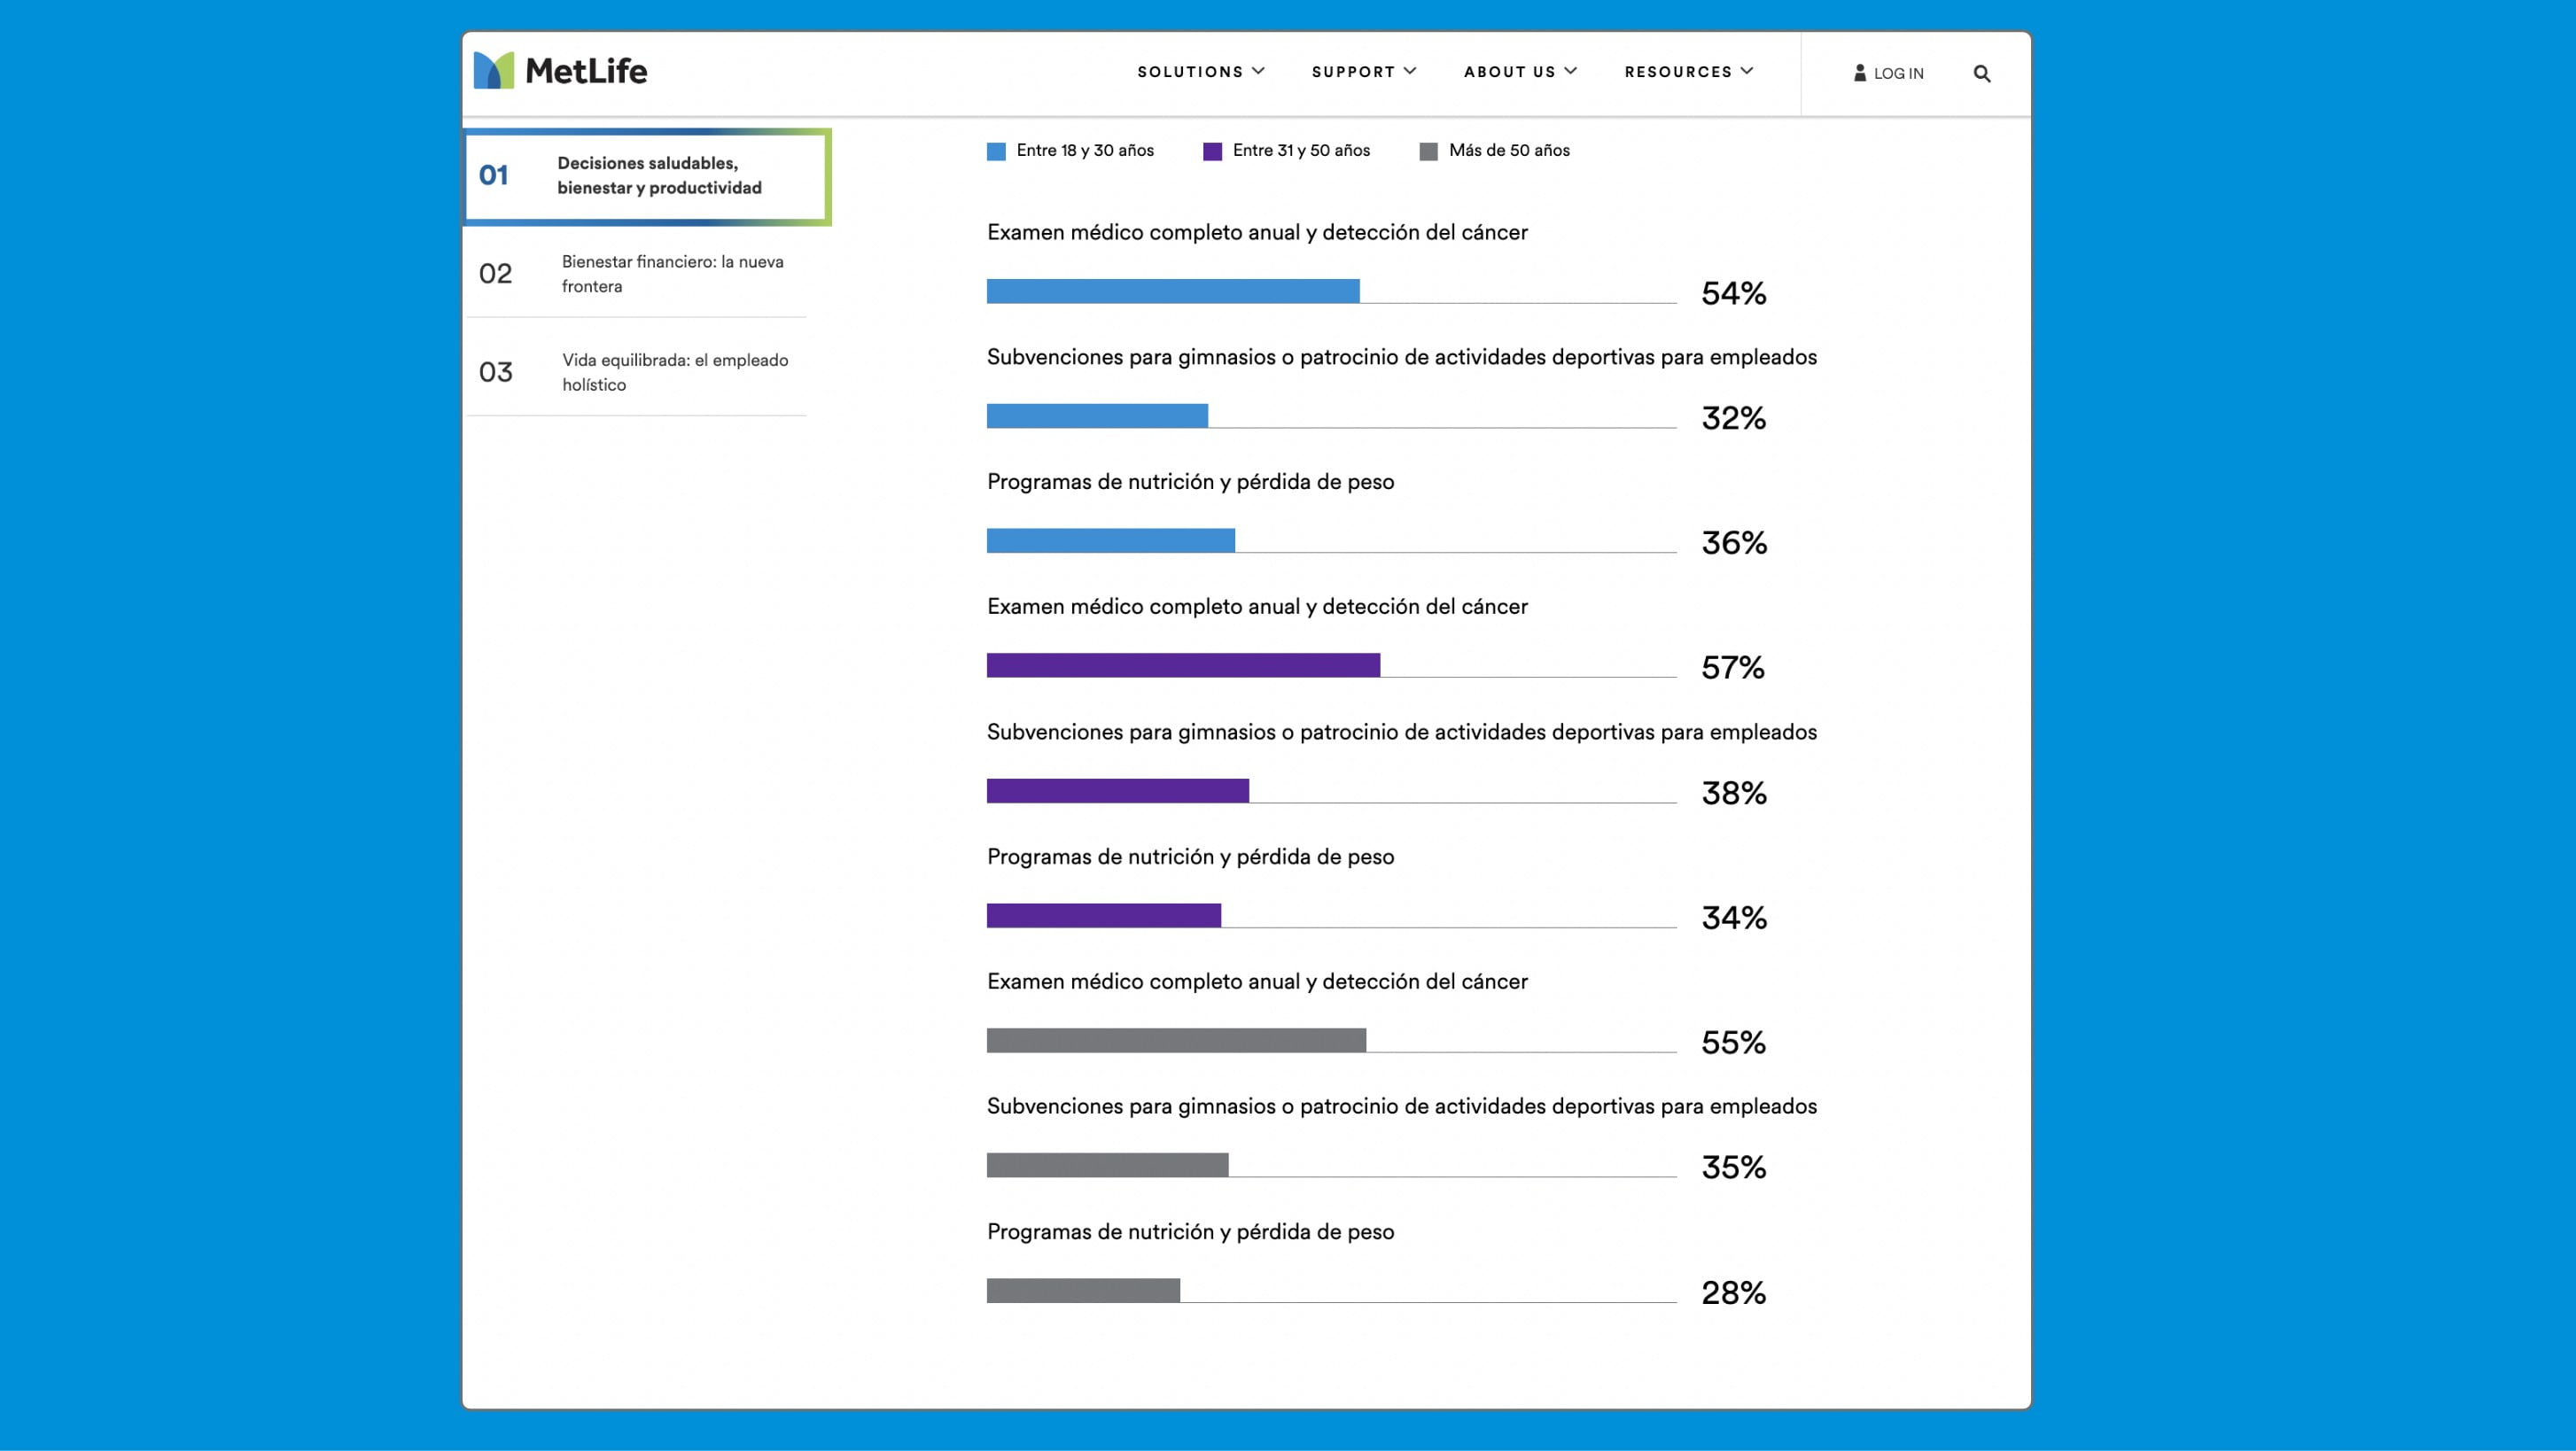
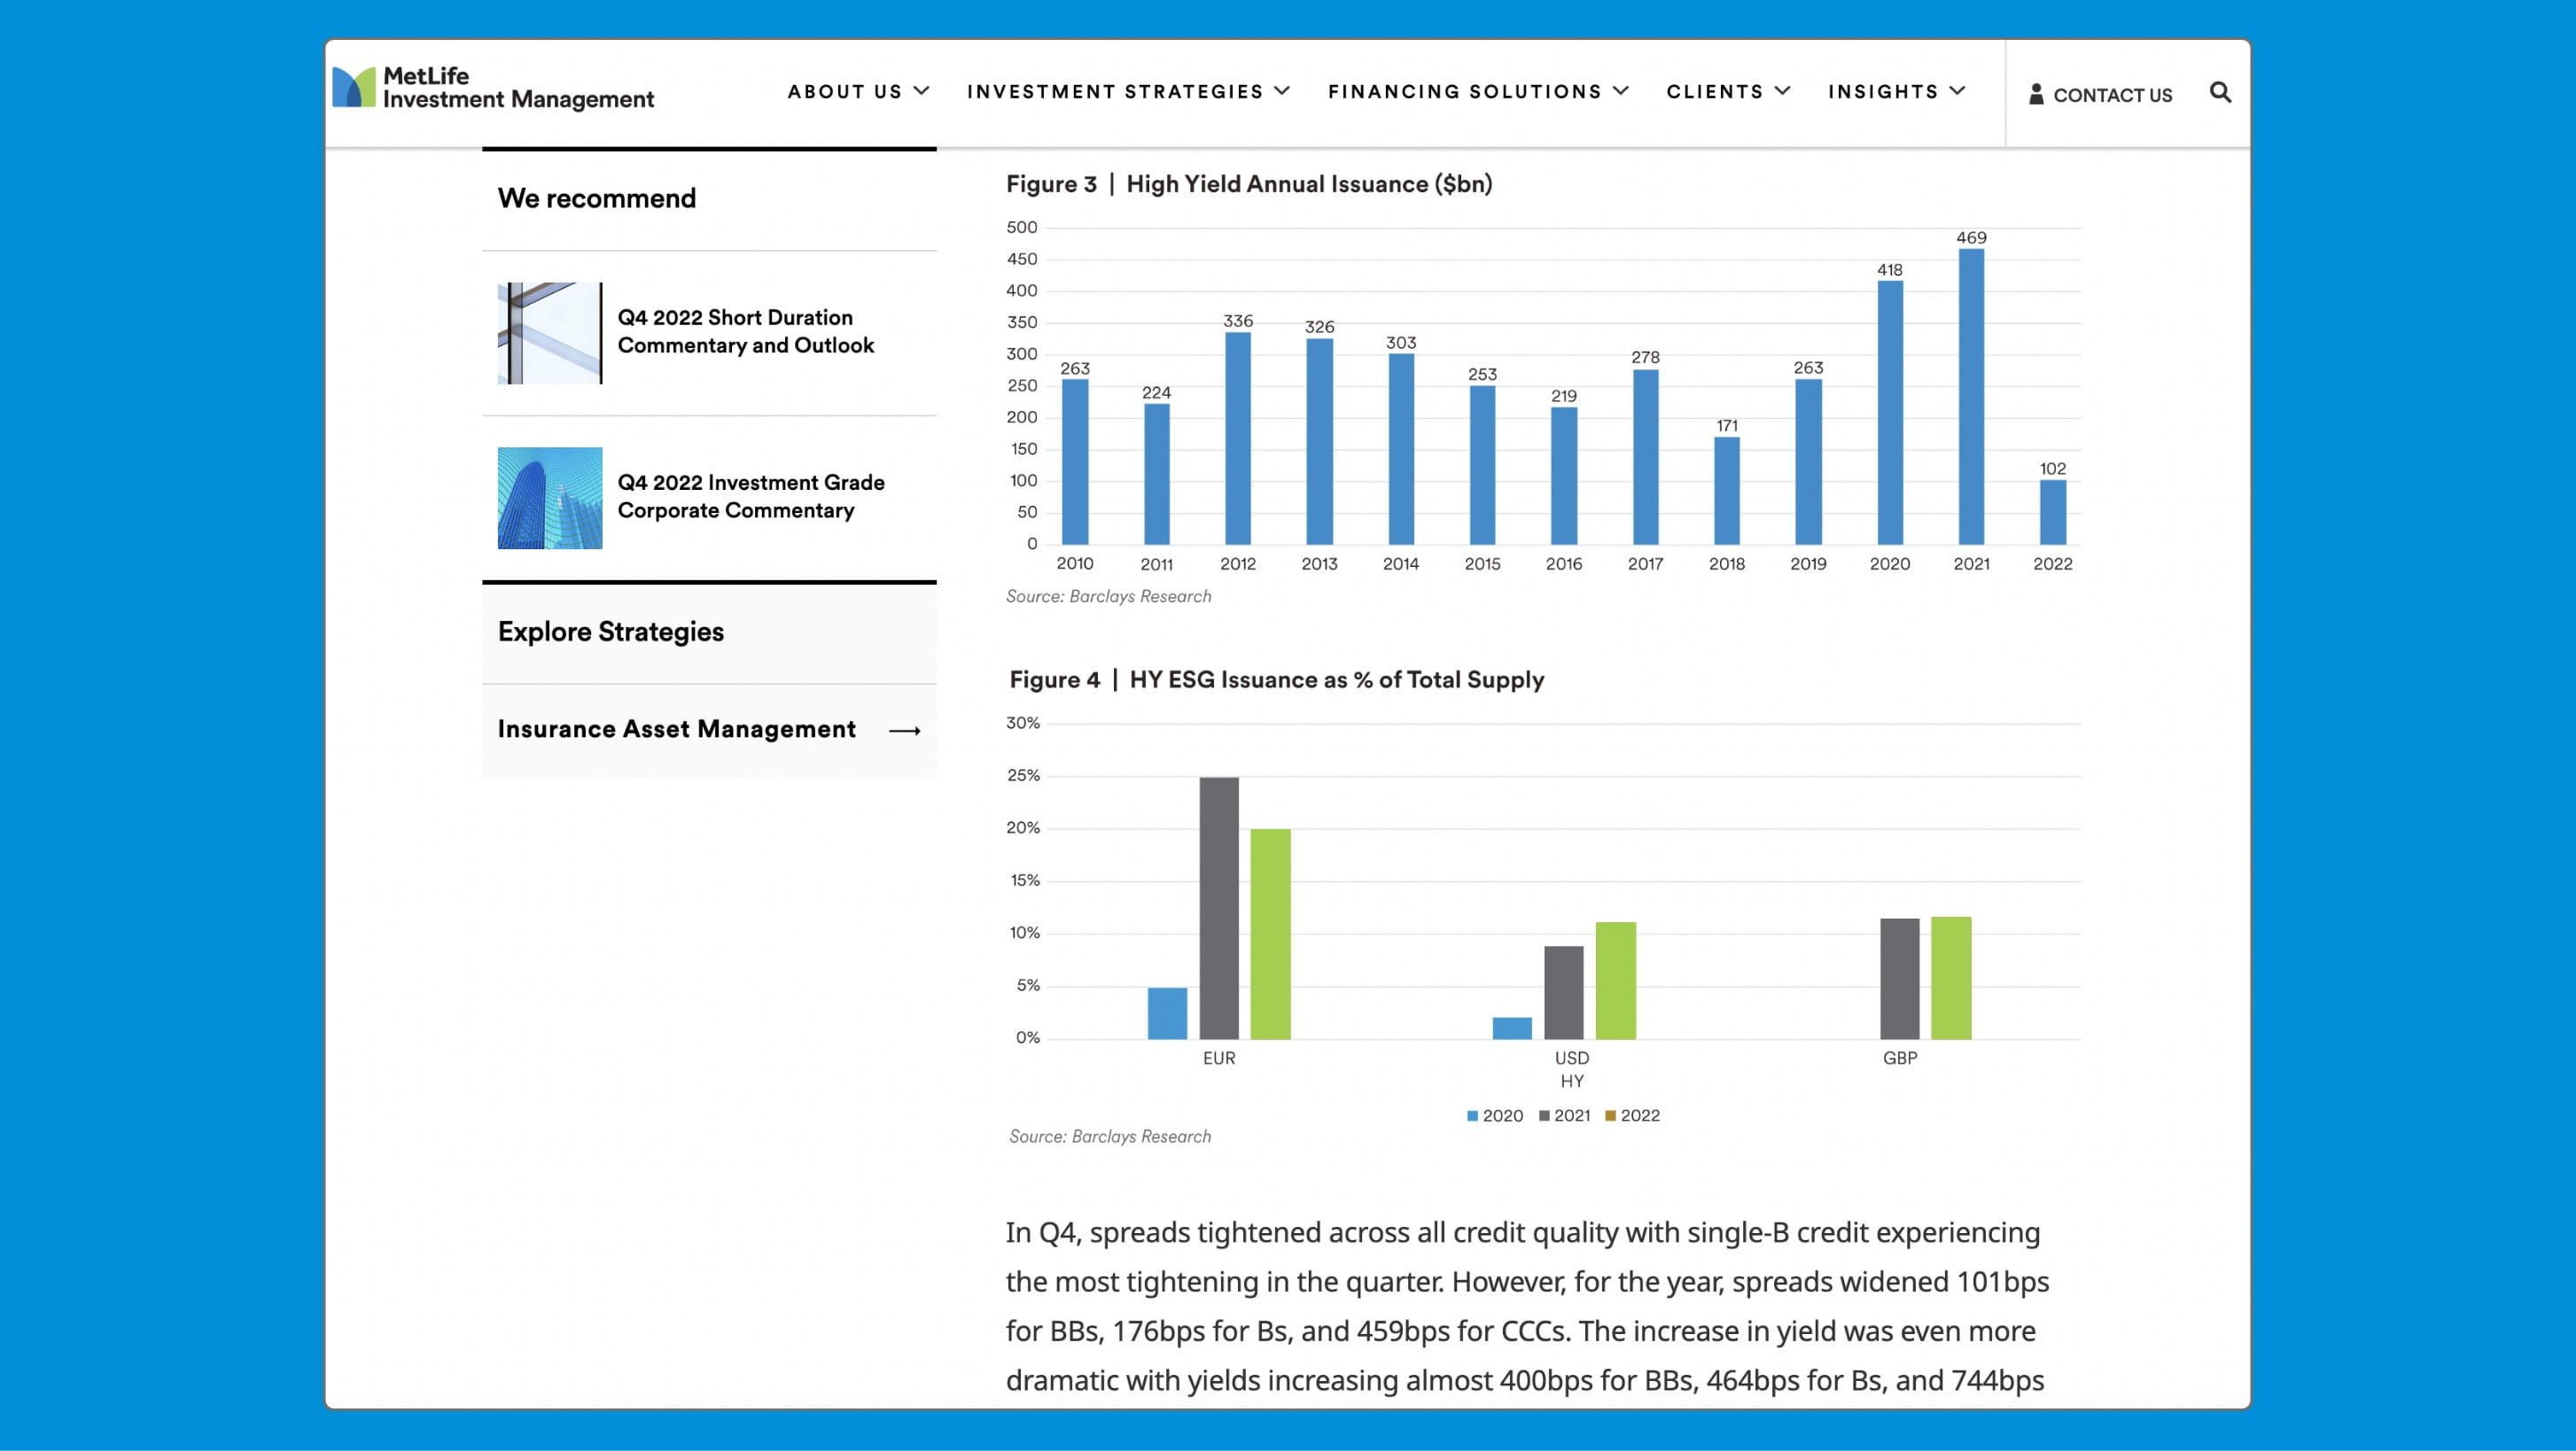
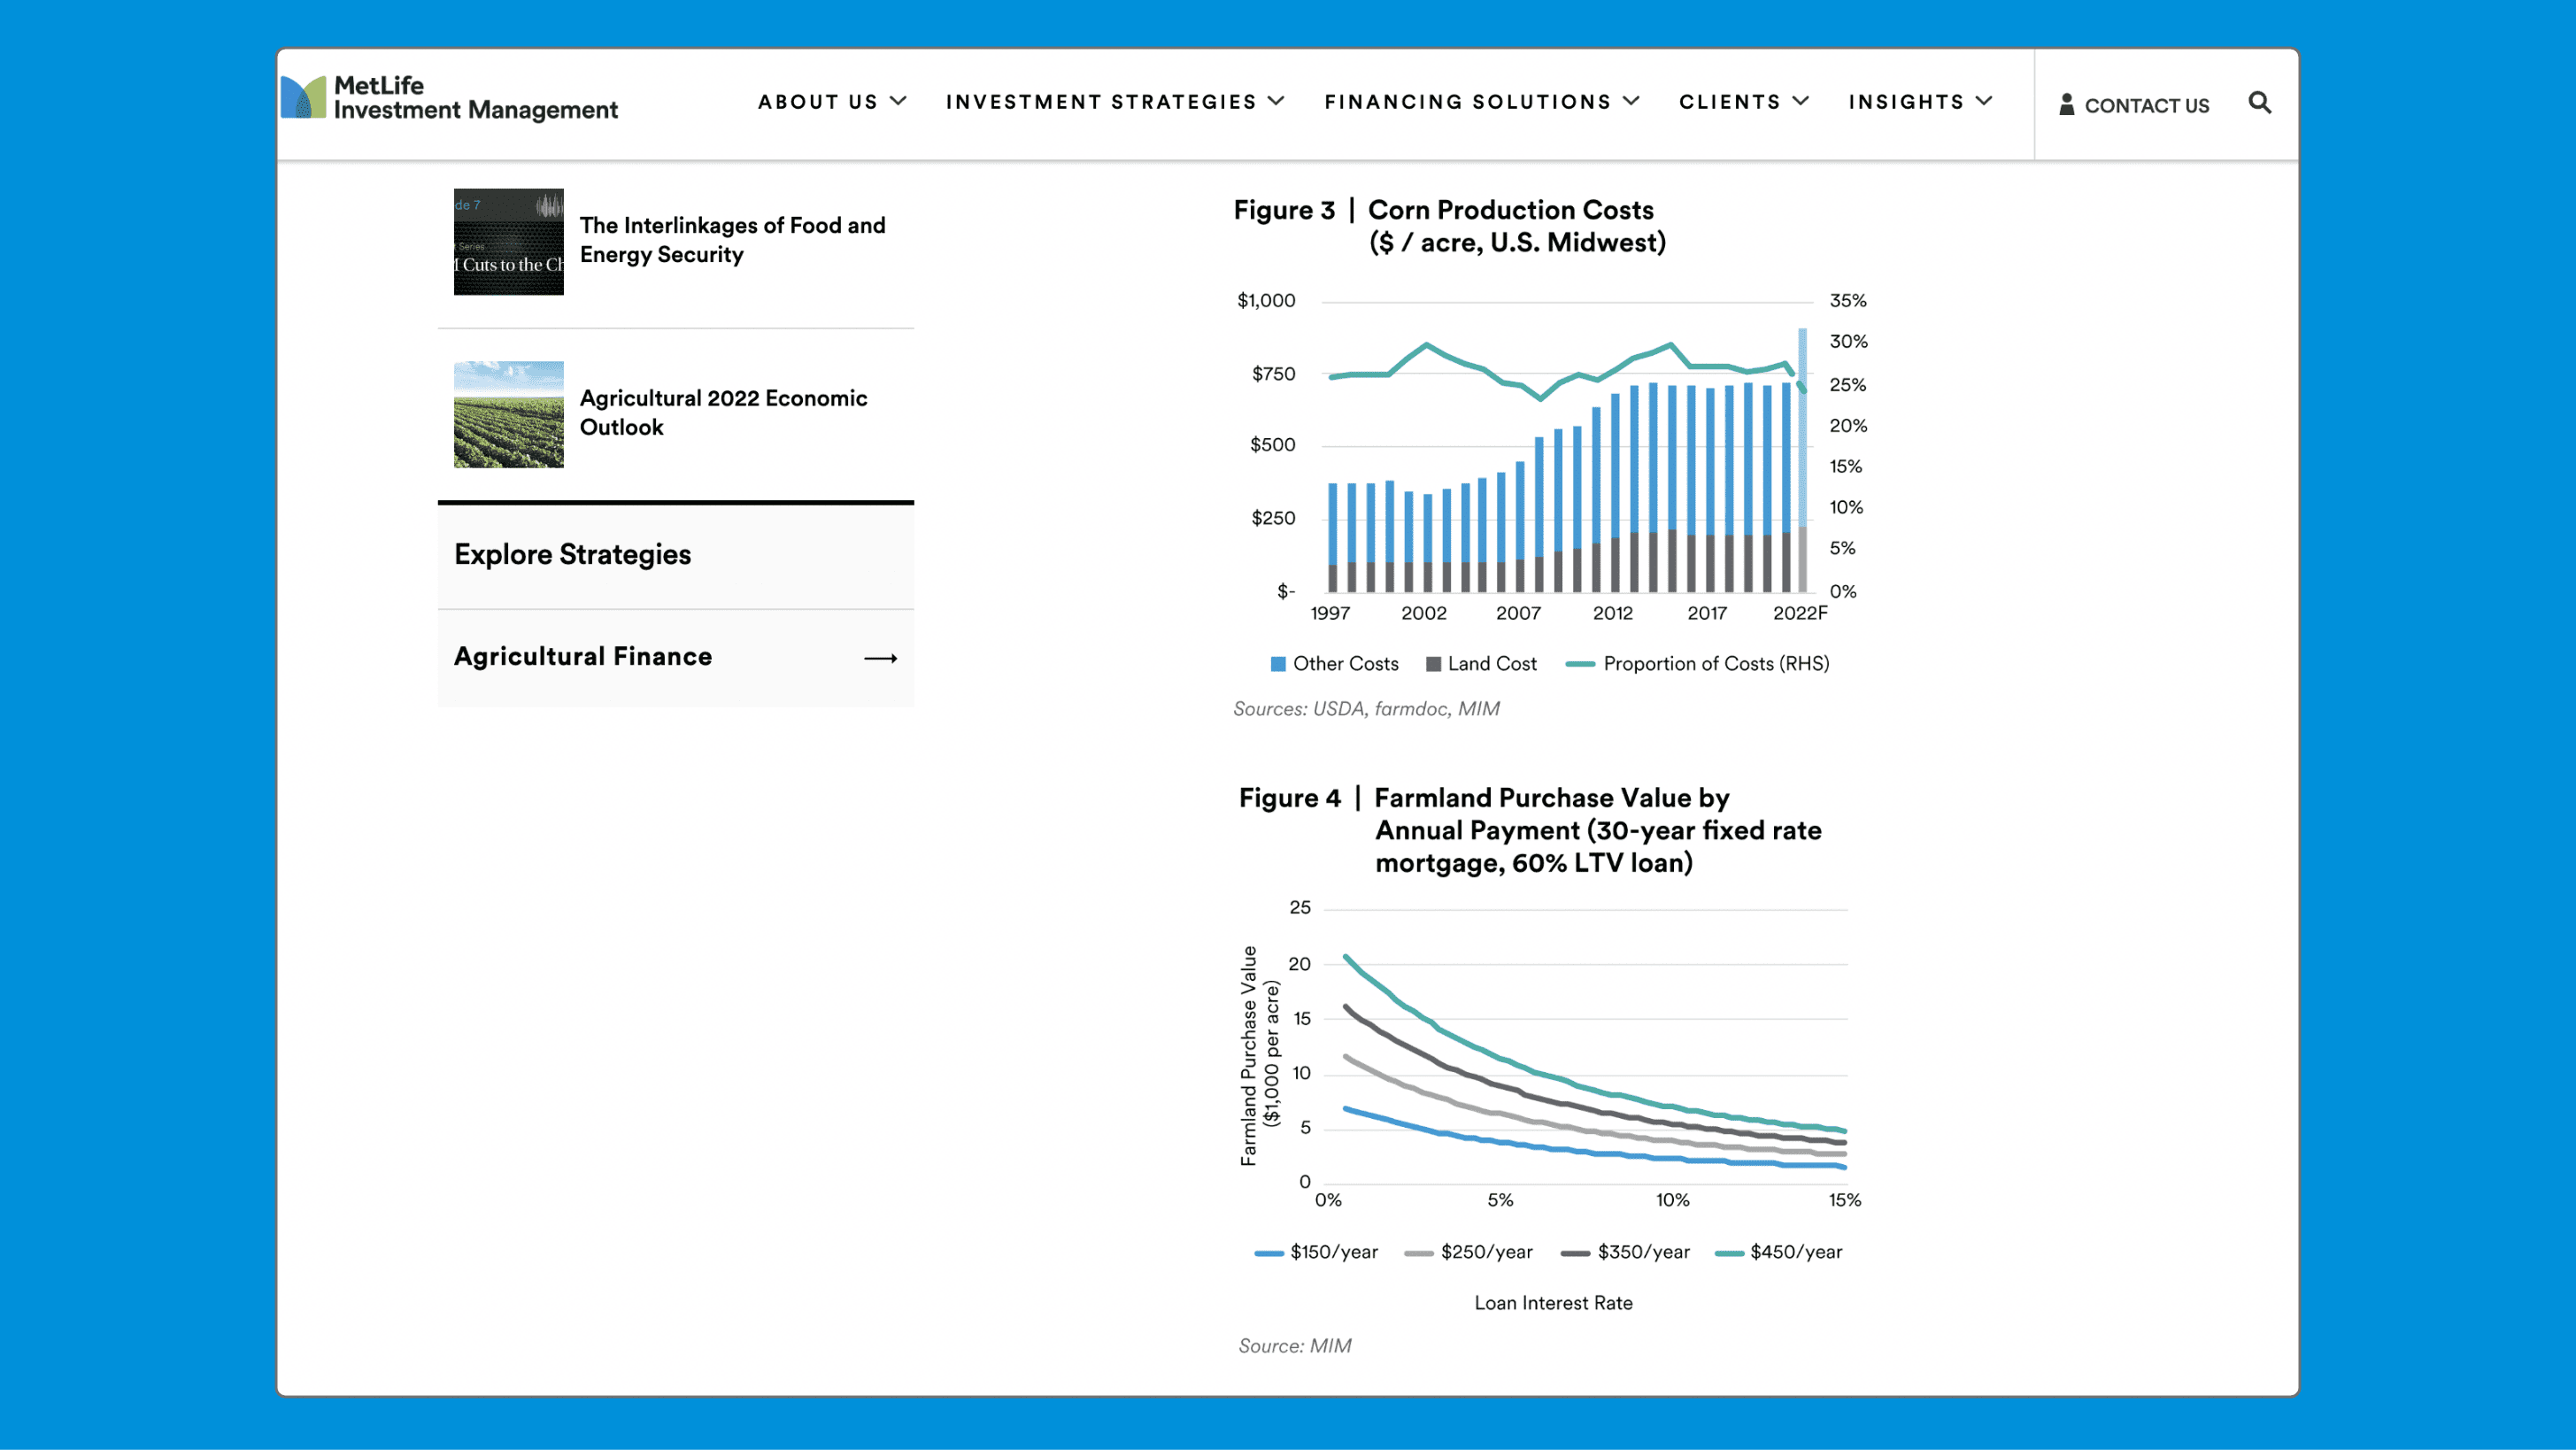
Bar or Column charts are ideal when comparing discrete categories, change of data over period of time and even comparing multiple data point changes over a period of time. Use bar charts when the number of data points are fewer and can easily be displayed on your designated screen space without crowding. For a wider screen, number of data points between 15-20 is preferred, while on a smaller screen 6 data points are good enough to clearly display your data. Depending on use case, you can choose between various types of bar charts, some examples are provided below.
Some use cases include:
- Portfolio Performance
- Yield value over the period of time (months/years)
- Votes for various data points
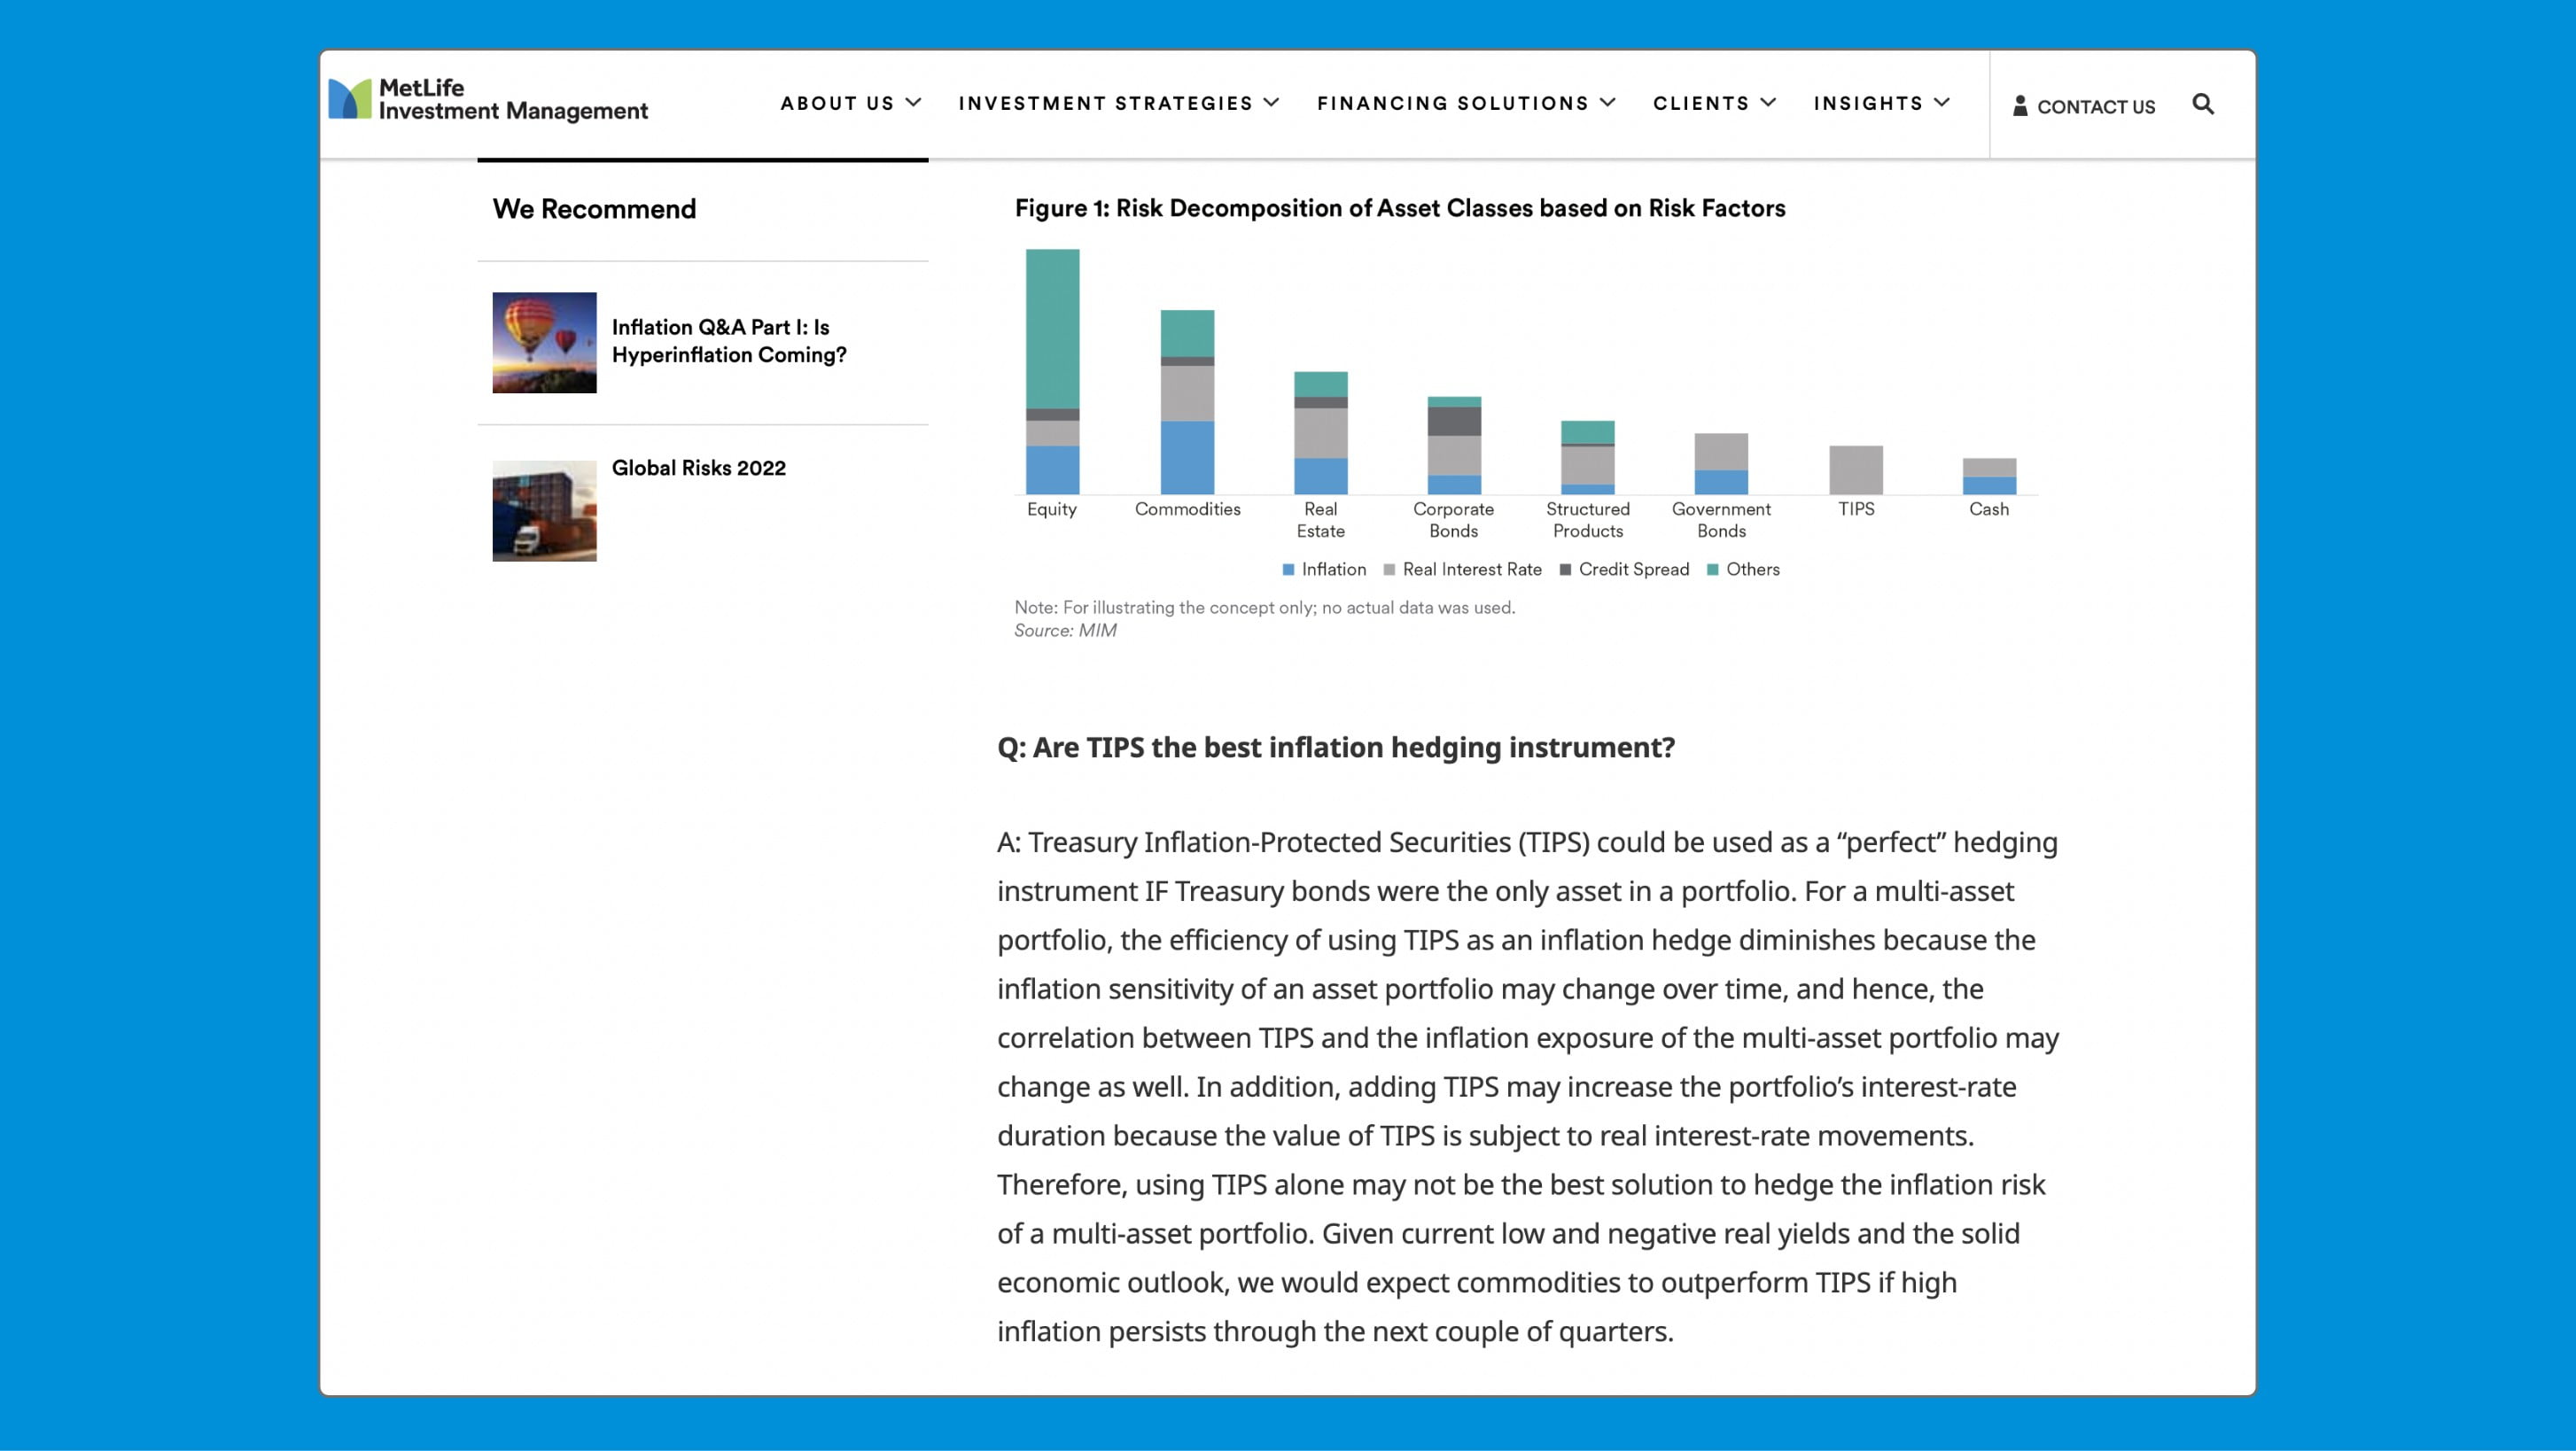
Complex Data - Ideal for large screen space
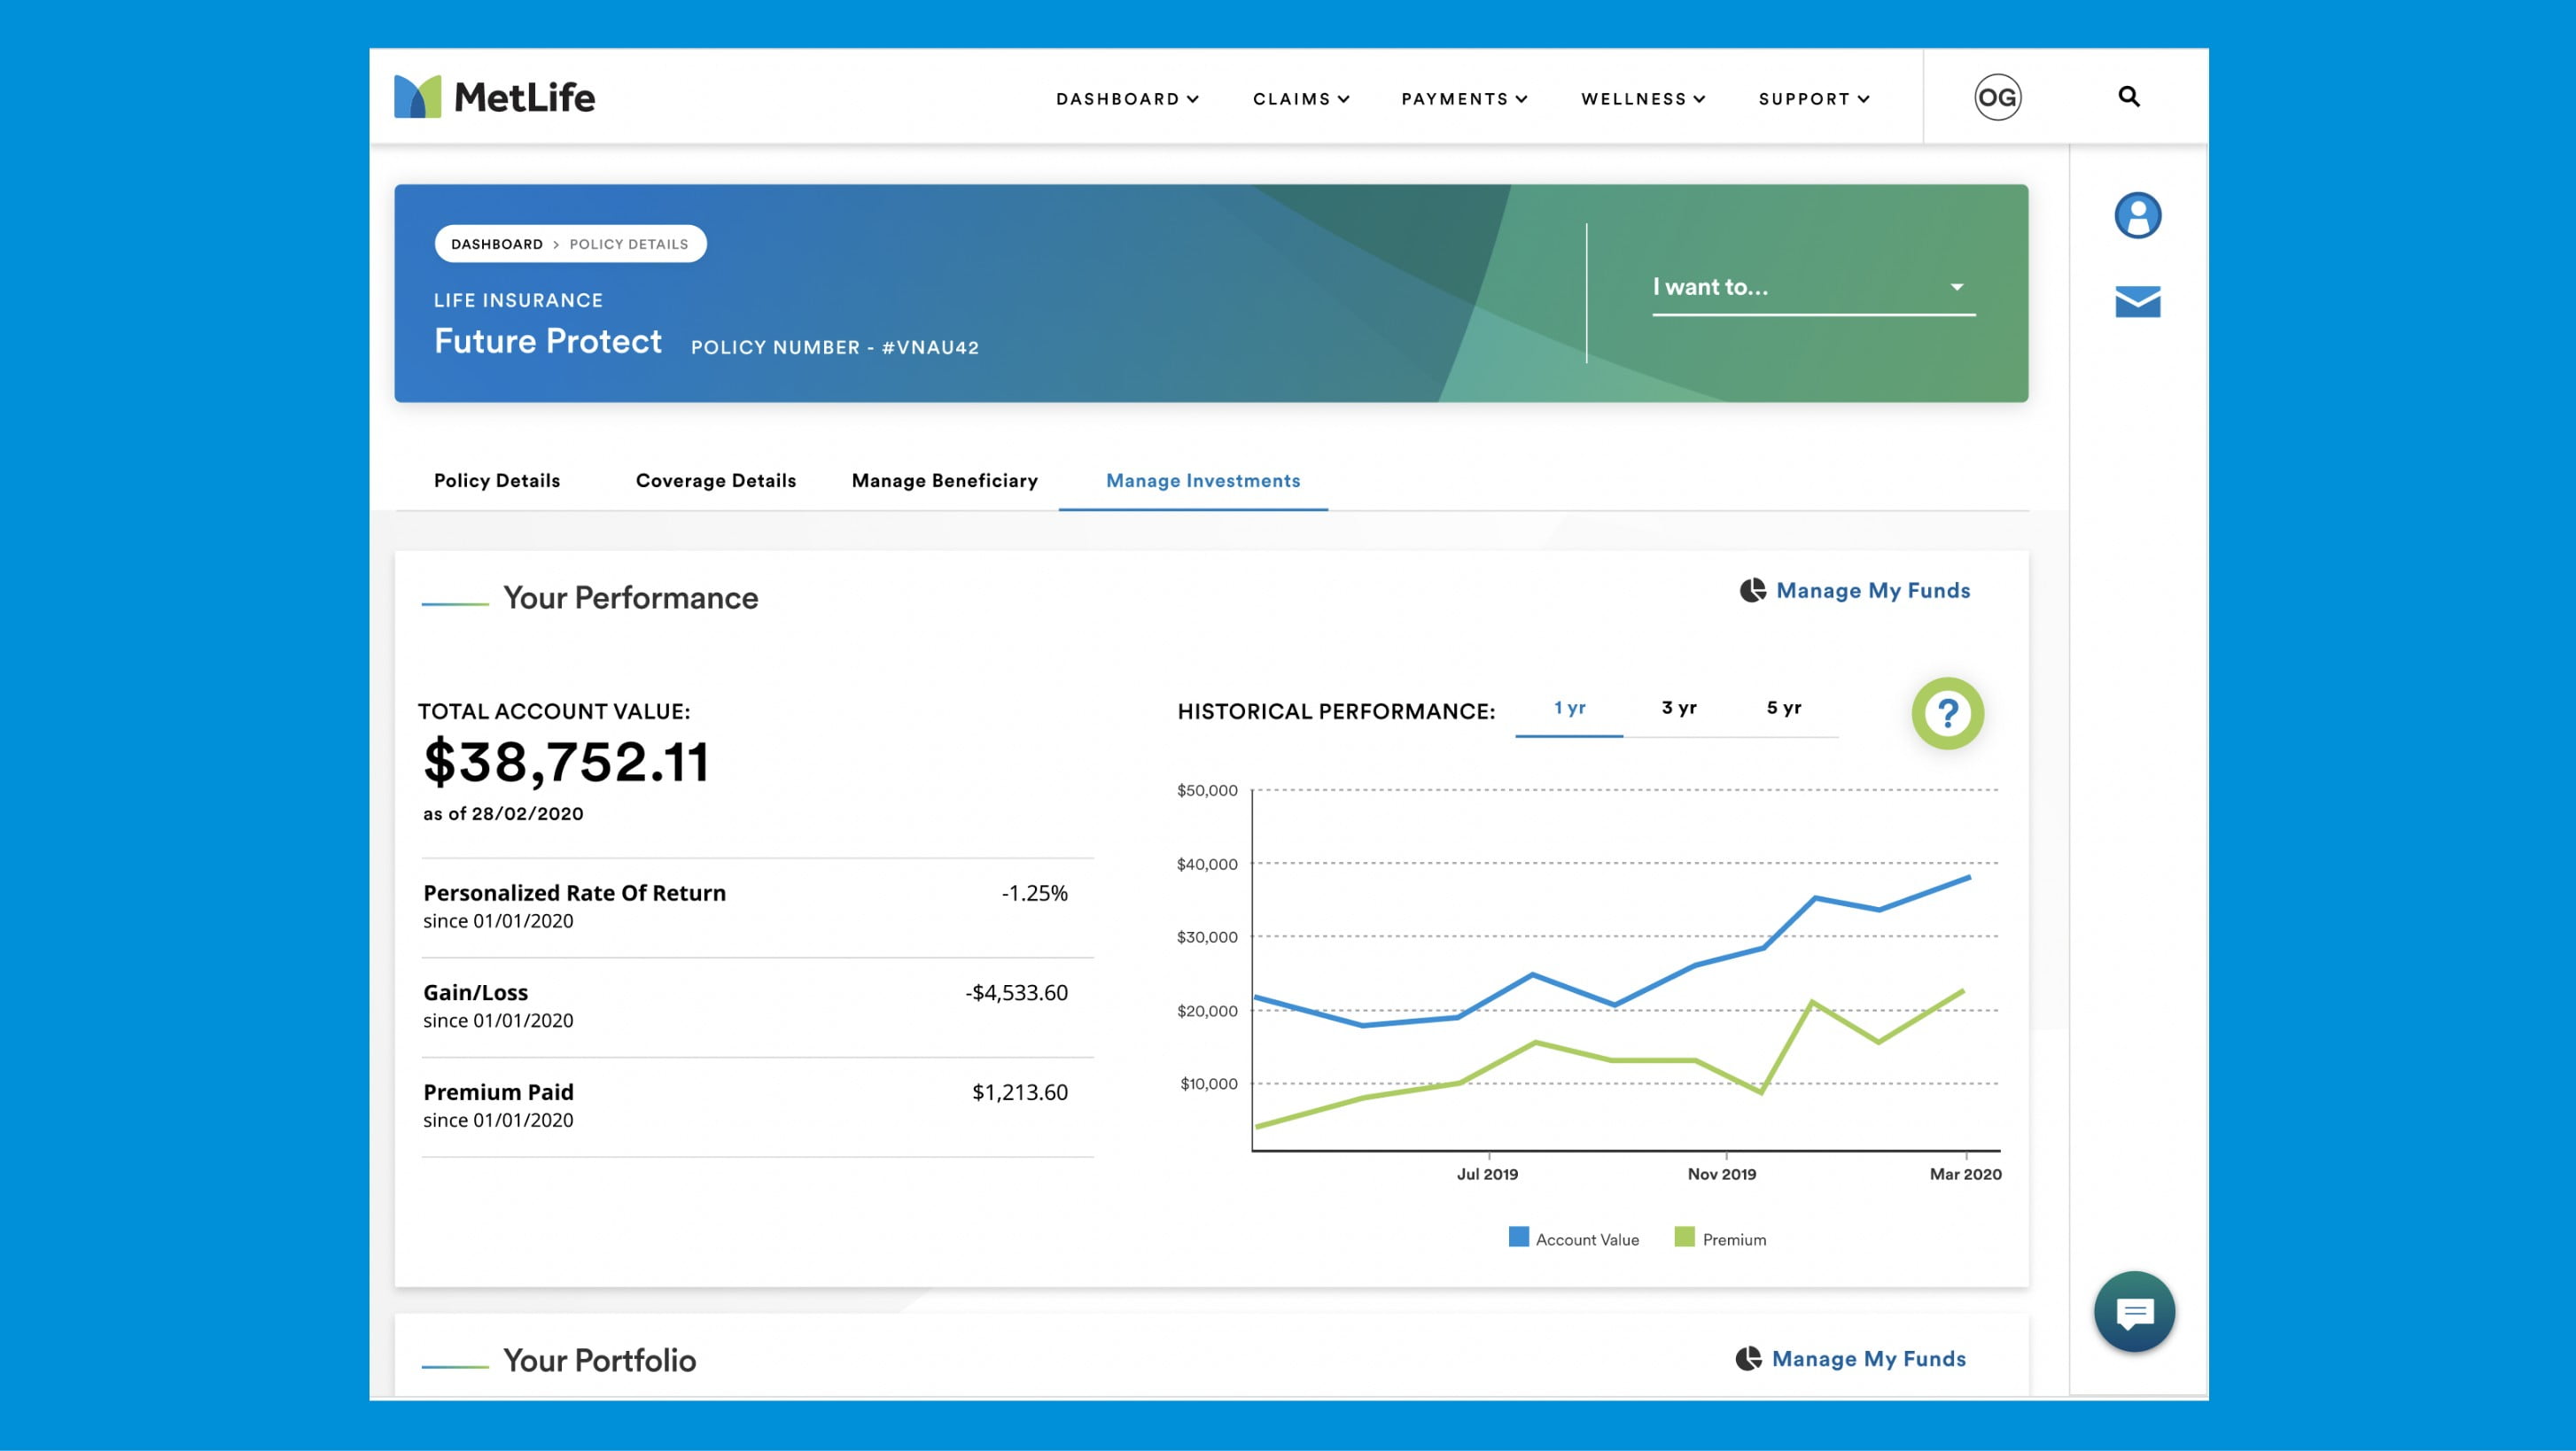
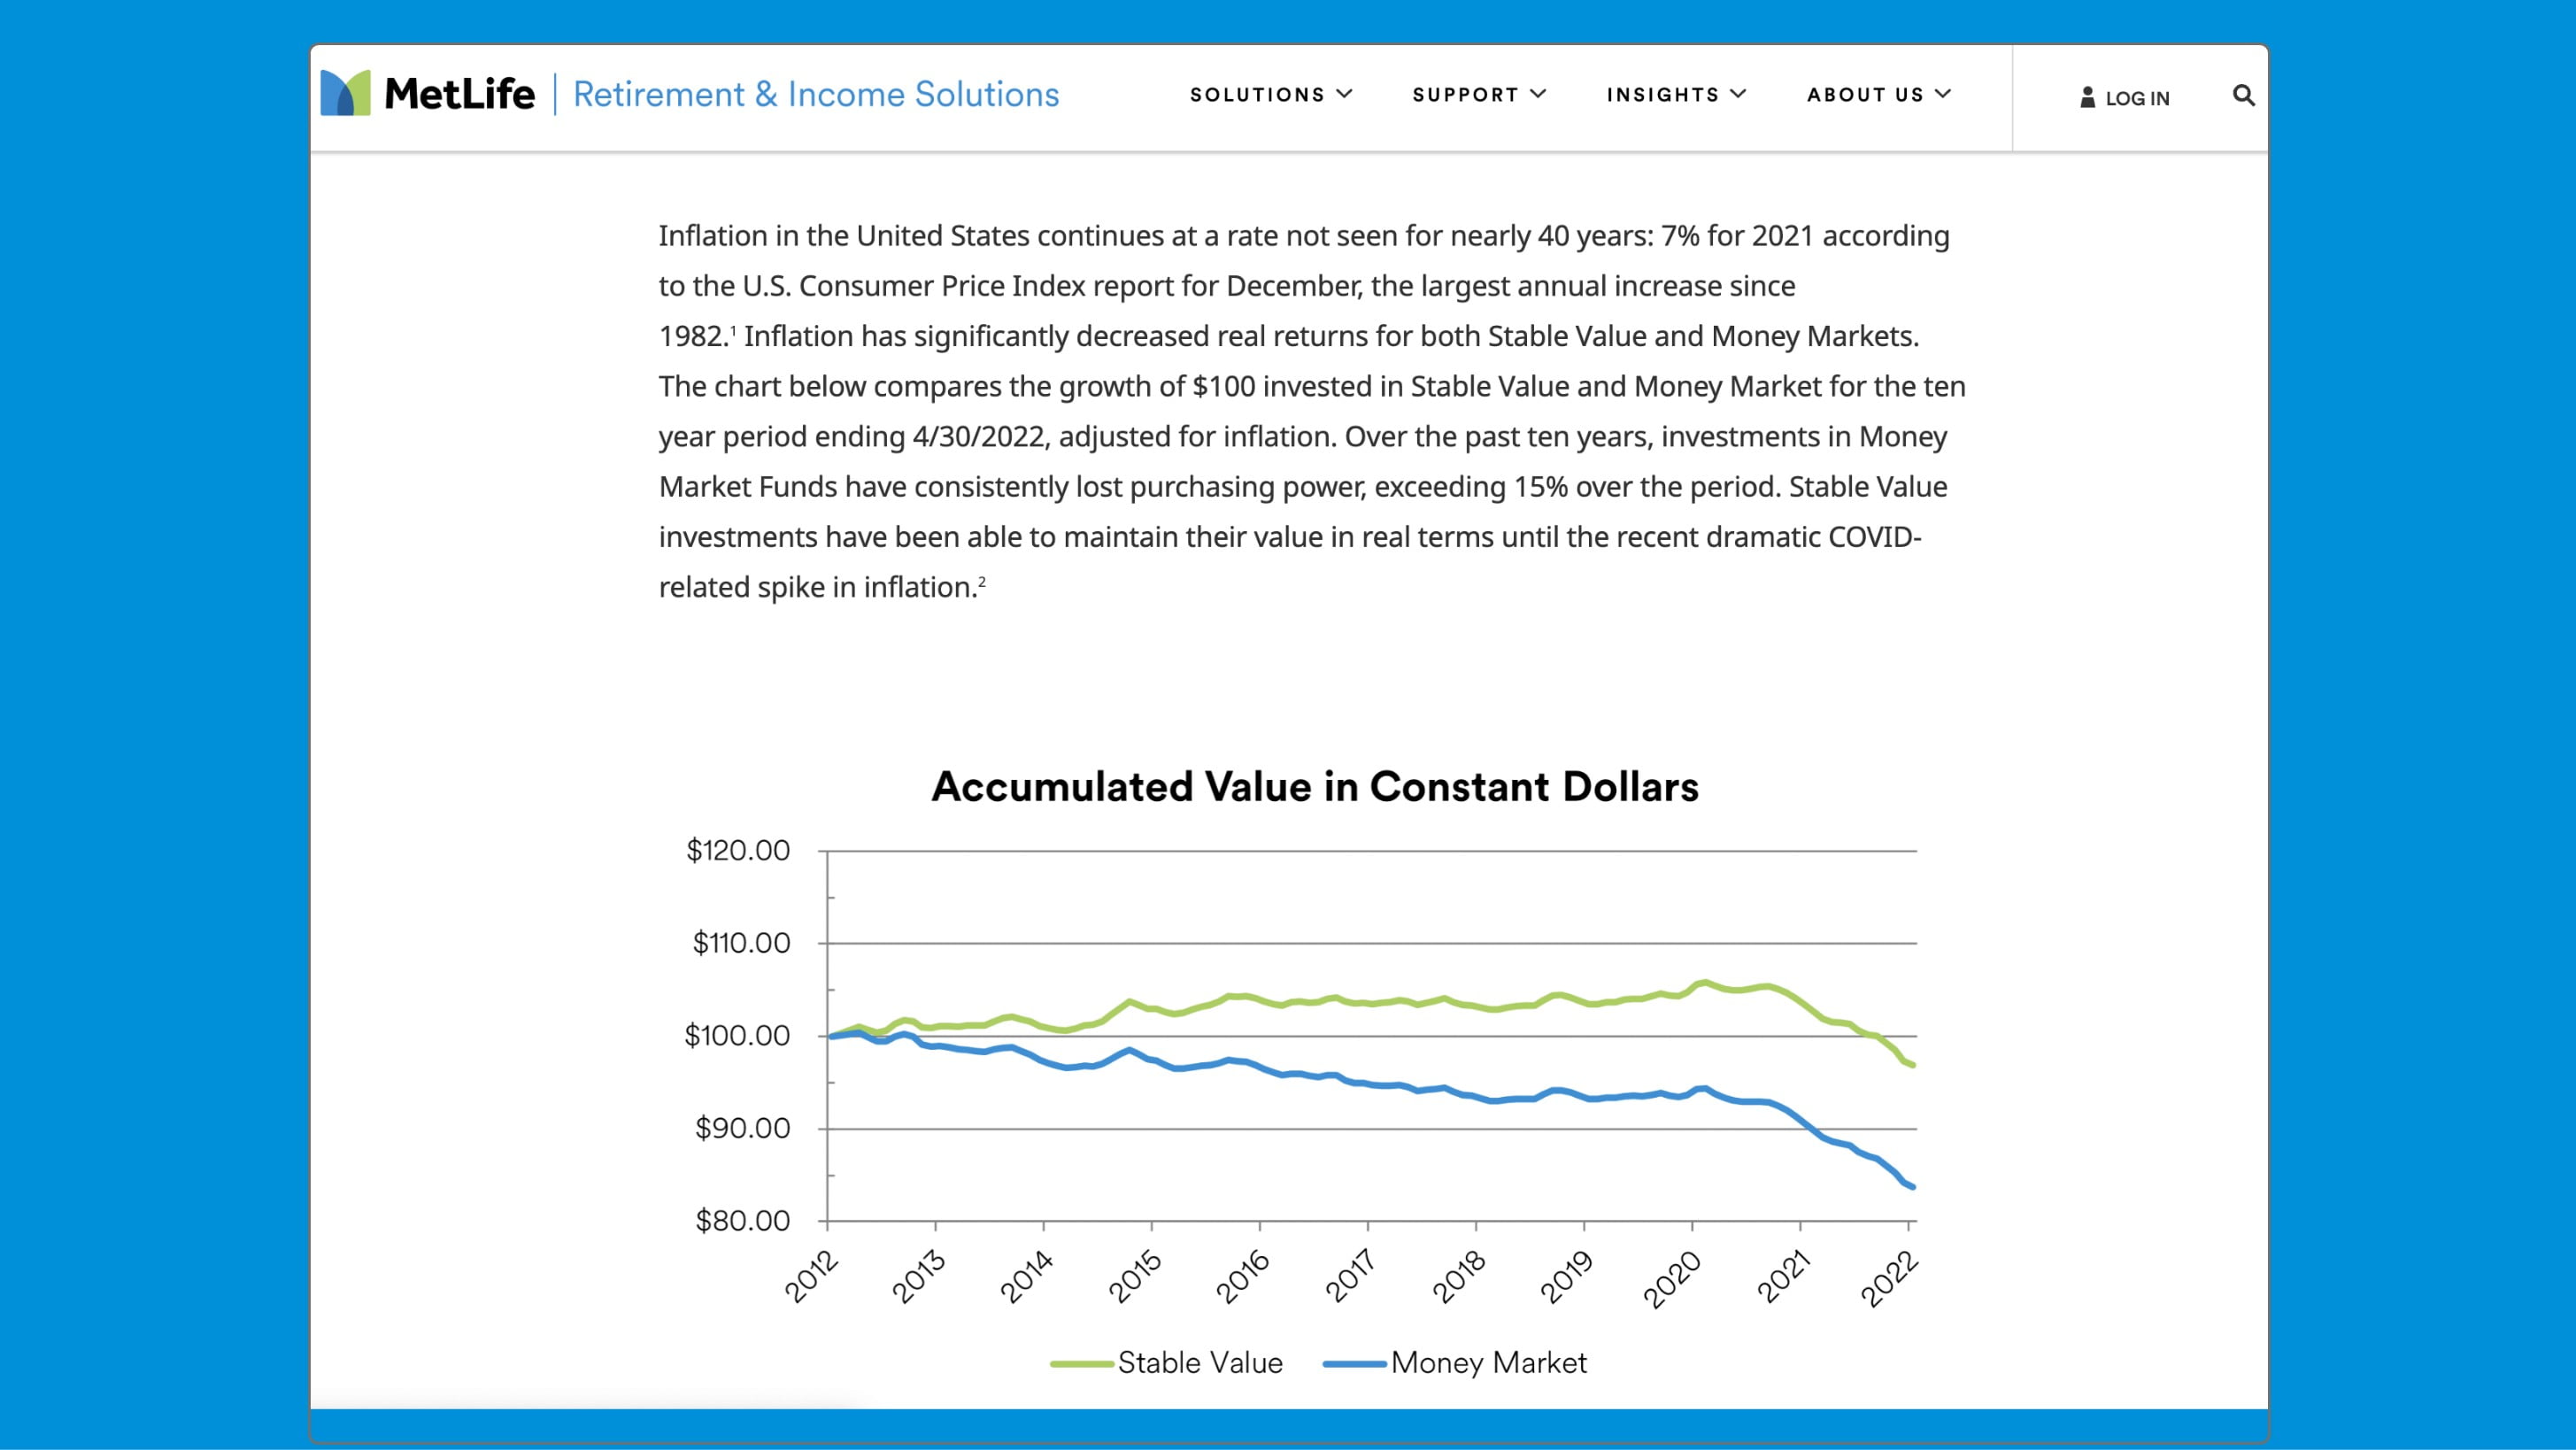
When you are dealing with large data sets, tracking changes over smaller periods of time, or data has much smaller level of value needed to be displayed – line, area or plot charts are recommended.
Some use cases include:
- Investment Portfolio Management
- Trend Analysis (analyze large sets of data over time to identify trends in customer behavior, market trends, other factors that can affect business)
- Compliance reporting (large sets of data required to show compliance with regulations)
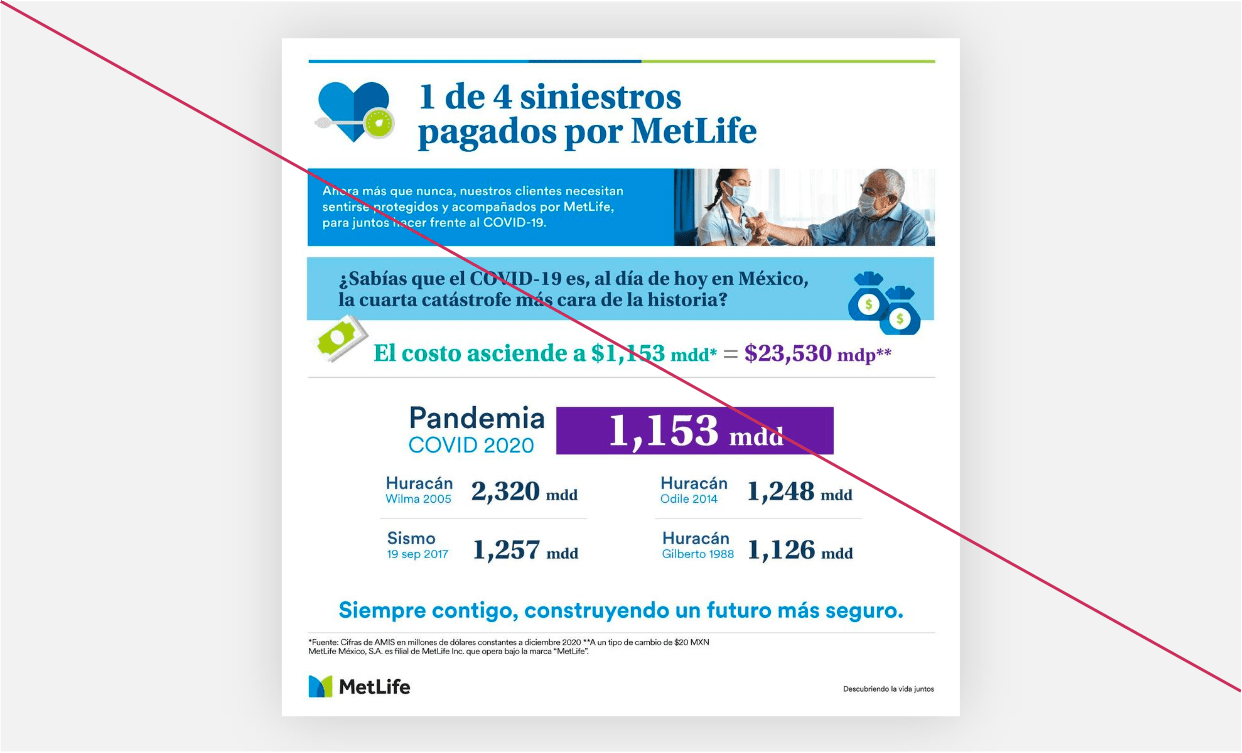
Infographics
Infographics are an effective way to visually communicate complex information and data in a clear and concise manner. Whether it’s statistics, percentages, or other numerical data, the components below can help make the information more accessible to the user.
Accessibility
MetLife is committed to designing and developing digital experiences for everyone. While data visualization is an effective way to grab user attention and convey useful information in more visual manner it is equally important to make sure your data visualization is compliant with all the required WCAG 2.1 AA standards and accessible by everyone.
Prefer simple, familiar visualizations and simple understandable language for your data vizualization.
- Avoid using complex novelty chart to represent your data as it can be hard to understand to users. If using a complex or novel visualization, make sure that it is accompanied by a text description.
- Simple and plain language is helpful to understand by users with various cognitive impairments, non-native speakers as well as other users.
Make the data available in an alternate format which is accessible like data table or simple RTF.
- While data viz can be visually appealing, not all users may be able to access or interpret the information they present. It is important to include the data in a different format, such as a data table or text-based report, to provide users with alternative means of accessing and understanding the information.
Ensure sufficient contrast between elements in the visualization.
- To achieve sufficient separation between two close elements in data viz, make sure to use colors from the pallet in provided order as they have enough contrast ratio between them.
Don’t reply on color only to convert information in your graph or charts.
- Data labels, symbols, annotations and tooltips are some common ways to convey additional information in visualizations without relying on color.
Ensure text in your graphs and charts are easily readable.
- Make sure your labels and other text elements font size is not too small. Make sure they are not obstructed by any other elements and has sufficient contrast against its background.
Make interactive visualizations keyboard-accessible.
- Try to avoid animation and hover states. Other interactions if present has to be keyboard accessible.
Ensure the visualization is responsive to different screen sizes and zoom levels.
- Test on different devices to ensure that it displays correctly and is readable of all devices.
- For mobile devices optimize the visualization by using scrollable containers, collapsing sections, or reducing the amount of information displayed.